
Last updated on 23rd Apr 2025| 7925
- Introduction
- What is Streamlit?
- Why Choose Streamlit for Web Development?
- Streamlit Installation and Setup
- Key Features of Streamlit
- Creating Your First Streamlit App
- Advanced Streamlit Features
- Deployment of Streamlit Apps
- Conclusion
Introduction
In today’s world, where interactive data visualization and web-based applications play a vital role in data science and machine learning, building intuitive web applications has become essential for professionals in various domains. For Python developers, Streamlit has emerged as one of the most powerful tools for rapidly creating interactive, data-driven web applications. Streamlit is an open-source Python framework designed to build beautiful, user-friendly, and functional web applications with just a few lines of code. Streamlit’s simplicity, flexibility, and seamless integration with popular data science libraries like Pandas, Matplotlib, Plotly, and others make it an excellent tool for Data Science Training and application development. Whether you’re a data scientist, machine learning engineer, or Python enthusiast, Streamlit offers an easy entry point into the world of web development, enabling you to create interactive dashboards, data visualizations, and machine learning apps effortlessly. This blog will explore what Streamlit is, why it’s an excellent tool for building web apps, and how to leverage it to develop your applications with Python. By the end, you’ll have a solid understanding of how to use Streamlit to turn your data science and machine learning projects into fully interactive web apps that anyone can use.
Eager to Acquire Your Data Science Certification? View The Data Science Course Offered By ACTE Right Now!
What is Streamlit?
Streamlit is a Python-based framework that lets you quickly create and deploy interactive web applications for data science and machine learning. It was designed to simplify the process of building web apps, making it accessible to people without any experience in web development. Unlike traditional web frameworks like Flask or Django, Streamlit requires very little boilerplate code. You don’t need to worry about setting up HTML, CSS, or Java Script Streamlit, which automatically handles these details behind the scenes. With just a few Python lines, you can create dynamic user interfaces and display interactive plots, tables, and machine-learning models. The best part? Streamlit apps are created purely using Python code, meaning you don’t need to learn any new programming languages to start building robust applications.
Why Choose Streamlit for Web Development?
- Ease of Use Streamlit is incredibly user-friendly. Its API is simple, intuitive, and designed for rapid prototyping, making it a perfect tool for data scientists, researchers, and machine learning engineers who want to visualize and quickly present their work in an interactive format.
- Speed and Performance Streamlit allows you to create apps incredibly quickly. This is particularly useful when working with data that needs to be analyzed and presented dynamically. You can easily modify the app’s UI components, rerun the code, and instantly see the results.
- Integration with Data Science Libraries Streamlit is built to integrate seamlessly with libraries commonly used in data science and machine learning, such as Pandas, NumPy, Matplotlib, Seaborn, Plotly, and sci-kit-learn. This allows for easy visualization of datasets, graphs, and Machine Learning Techniques and Models without writing complex JavaScript or HTML.
- Real-time Interactivity Streamlit’s reactive architecture ensures that any UI change (e.g., a slider or selecting a new option from a dropdown) automatically updates the application’s output in real-time, giving users an interactive experience.
Streamlight Installation and Setup
Before building your first Streamlit app, you must install Streamlit on your local machine. This is easy to do using pip, Python’s package installer.
- Step 1: Install Streamlight
To install Streamlit, run the following command in your terminal or command prompt:
- Pip install streamlet
- Step 2: Verify Installation
Once the installation is complete, you can verify that Streamlit is installed correctly by running this command:
- Streamlight –version
- Step 3: Start Your First Streamlit App
To create and run your first Streamlit app, create a Python Programming file (e.g., app.py) and add the following simple code:
Now, run the app with the command:- Import streamlet as st
- st.title(“Hello, Streamlit!”)
- st.write(“This is your first Streamlit app!”)
- Streamlight run app.py
Your app will open in a web browser, and the text you wrote will be displayed on the page.
Excited to Obtaining Your Data Science Certificate? View The Data Science Training Offered By ACTE Right Now!
Key Features of Streamlight
Simplicity in Code
Streamlit’s API is straightforward and clean. A few lines of Python code allow you to add text, graphs, buttons, sliders, and more. The following are some essential Streamlit elements:
- st.title(): Adds a title to the app.
- st.write(): Displays text or outputs, such as data frames, charts, etc.
- st.slider(): Adds an interactive slider.
- st.button(): Adds a button to trigger an action.
Real-time Interactivity
Streamlit’s design ensures that when users interact with the app (e.g., using sliders, dropdown menus, etc.), the app automatically reruns and updates the output. This feature, especially valuable in Data science Training, enables real-time feedback and dynamic data visualizations.
Easy Integration with Libraries
Streamlit integrates smoothly with popular Python libraries. For example, it supports visualizing Pandas DataFrames, using Matplotlib and Plotly for interactive plots, and even embedding machine learning models for prediction.
Interested in Pursuing Data Science Master’s Program? Enroll For Data Science Master Course Today!
Creating Your First Streamlit App
Building a Basic Web App
Here’s an example of building a simple web app that displays a dataset and a plot using Streamlit.
- import streamlet as st
- import streamlet as st
- import pandas as PD
- import numpy as np
- import matplotlib.pyplot as plt
- # Create a simple dataset
- data = pd.DataFrame({
- ‘x’: np.linspace(0, 10, 100),
- ‘y’: np.sin(np.linspace(0, 10, 100))
- })
- # Display the data frame
- st.write(“Here is a simple dataset:”)
- st.write(data)
- # Create a plot
- st.write(“Here is a plot of the dataset:”)
- fig, ax = plt.subplots()
- ax.plot(data[‘x’], data[‘y’])
- st.pyplot(fig)
Running this code will display the dataset and the plot on your app’s interface.
Adding Widgets for Interactivity
Streamlit’s widgets allow you to add interactivity to your app. Here’s an example of using a slider to change a plot dynamically:
- import streamlet as st
- import numpy as np
- import matplotlib.pyplot as plt
- # Add a slider to control the frequency of the sine wave
- freq = st.slider(‘Select frequency’, 1, 10, 2)
- # Generate a sine wave with the selected frequency
- x = np.linspace(0, 10, 100)
- y = np.sin(freq * x)
- # Create and display the plot
- fig, ax = plt.subplots()
- ax.plot(x, y)
- st.pyplot(fig)
With this app, users can change the sine wave frequency by interacting with the slider.
Advanced Streamlit Features
Streamlit provides advanced features, making it an even more powerful tool for building data-driven apps.
Using Plotly and Matplotlib for Data Visualization
You can integrate Plotly for highly interactive visualizations or use Matplotlib for basic plots. Here’s an example of using Plotly:
- import streamlet as st
- import plotly.express as px
- # Create a simple Plotly scatter plot
- df = px.data.iris()
- fig = px.scatter(df, x=’sepal_width’, y=’sepal_length’, color=’species’)
- st.plotly_chart(fig)
Preparing for a Data Science Job Interview? Check Out Our Blog on Data Science Interview Questions & Answer
Displaying DataFrames and Tables
Streamlit makes it easy to display data tables, which are especially useful for data science projects. You can display Pandas DataFrames directly:
- import streamlet as st
- import pandas as PD
- # Create a sample data frame
- df = pd.DataFrame({
- ‘Name’: [‘John,’ ‘Alice,’ ‘Bob’],
- ‘Age’: [25, 30, 22]
- })
- # Display the data frame
- st. write(pdf)

Incorporating Machine Learning Models
Streamlit makes it simple to integrate machine learning models. You can showcase models built in Scikit-learn or any other library, allowing users to interact with them. Here’s a quick example with a model prediction:
- Import streamlit as st
- from sklearn.datasets import load_iris
- from sklearn. Ensemble import RandomForestClassifier
- # Load Iris dataset
- data = load_iris()
- X, y = data.data, data.target
- # Train a model
- model = RandomForestClassifier()
- model.fit(X, y)
- # Input from user
- sepal_length = st.slider(“Sepal Length”, 4.0, 8.0, 5.0)
- # Predict the class
- prediction = model.predict([[sepal_length, 3.2, 4.5, 1.5]])
- st.write(f”Predicted class: {data.target_names[prediction[0]]}”)
Data Science Sample Resumes! Download & Edit, Get Noticed by Top Employers! DownloadDeployment of Streamlit Apps
You can do another once you’ve built your Streamlit app. You can deploy your app in several ways:
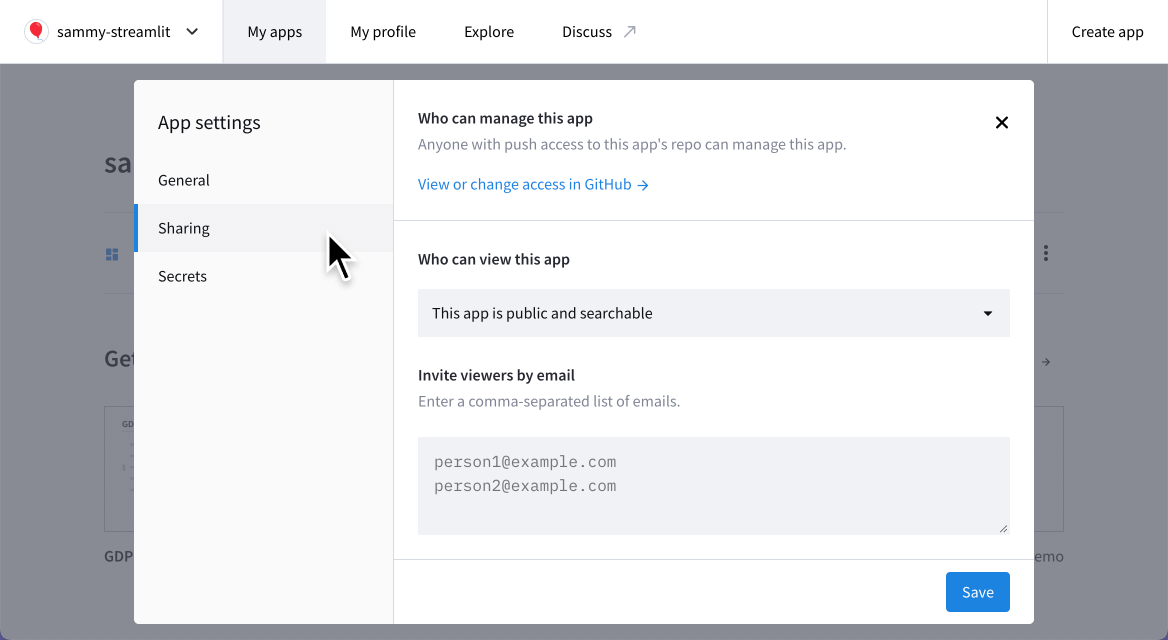
- Hosting on Streamlit Cloud: Streamlit offers a free platform for hosting and sharing apps. You can quickly deploy your app by pushing it to GitHub and linking it to Streamlit Cloud.
- Deployment on Other Platforms (Heroku, AWS): You can also deploy your app on other cloud platforms like Heroku, AWS, or Google Cloud, which offer greater flexibility and control over the hosting environment.
Conclusion
Streamlit is a fantastic tool for Python developers, data scientists, and machine learning engineers who want to rapidly build and deploy interactive web applications without needing extensive knowledge of web development. Its simplicity, real-time interactivity, and easy integration with data science libraries make it a go-to solution for turning Python code into user-friendly apps, especially in Data Science Training. Whether you’re visualizing data, presenting machine learning models, or sharing insights, Streamlit allows you to do it with minimal effort. Start building your Streamlit apps today, and unlock the power of Python in the world of web development!
This should return the version of Streamlit installed on your system.