
Last updated on 09th Aug 2025| 12969
- What is an Epoch?
- Role in Training Neural Networks
- Epoch vs Batch vs Iteration
- Overfitting and Underfitting
- Selecting the Right Number of Epochs
- Monitoring Model Performance
- Early Stopping Technique
- Visualization Tools
- Summary
What is an Epoch?
In machine learning, an epoch is one complete pass through the entire Role in training neural networks dataset by the Epoch in Machine Learning . During an epoch, every sample in the dataset has been seen once by the model, which allows the model to learn from the data and update its internal parameters (weights and biases). Although a single epoch represents one full pass, Epoch in Machine Learning a model rarely achieves optimal performance in just one epoch. Therefore, multiple epochs are typically used to gradually improve the model’s accuracy and reduce errors. The number of epochs is a hyperparameter that controls how many times the Neural Networks Machine Learning Training algorithm works through the entire dataset.In machine learning, an epoch refers to one complete pass through the entire training dataset during the learning process. When training a model, the algorithm updates its internal parameters (like weights in neural networks) by iterating over batches of data. Once the model has seen every sample in the dataset once, that counts as one epoch. Typically, training requires multiple epochs because a single pass is usually not enough for the model to learn the underlying patterns effectively. With each epoch, the model gradually improves by minimizing the error between its predictions and the actual outcomes.
Ready to Get Certified in Machine Learning? Explore the Program Now Machine Learning Online Training Offered By ACTE Right Now!
Role in Training Neural Networks
Epochs are fundamental to the training process of neural networks. Here’s how they fit into the broader training workflow:
- Initialize Weights: Neural networks begin with random weights.
- Forward Pass: Inputs are passed through the model to make predictions.
- Loss Calculation: The model’s prediction is compared to the true label using a loss function.
- Backward Pass (Backpropagation): The loss is used to calculate gradients.
- Weight Update: Weights are updated using an optimization algorithm, a concept central to What Is Machine Learning. (e.g., SGD, Adam).
- Repeat Steps for All Batches in Dataset: This constitutes one epoch.
The key idea is that with each successive epoch, the model learns a bit more about the data, gradually minimizing the loss function and improving accuracy.
Epoch vs Batch vs Iteration
When Role in training neural networks machine learning models, especially neural networks, these three terms describe how the training data is processed:
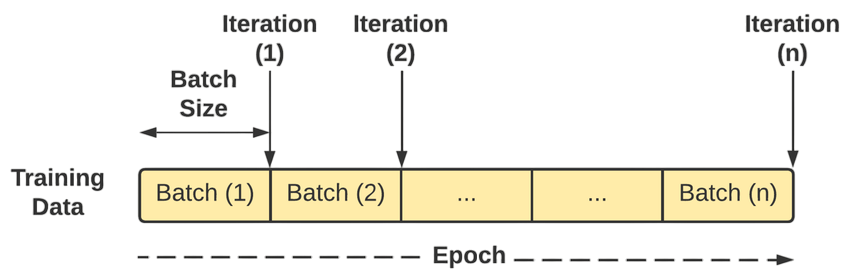
- An epoch is one complete pass through the entire Machine Learning Training dataset. During an epoch, the model sees every training sample once. Since datasets can be large, training usually requires multiple epochs to help the model learn effectively.
- A batch is a subset of the training data used to train the model in one step. Instead of processing the entire dataset at once (which can be computationally expensive), the data is divided into smaller batches. The batch size is a hyperparameter that defines how many samples the model processes before updating its parameters.
- An iteration refers to one update of the model’s parameters and occurs after processing one batch. So, the number of iterations per epoch is equal to the total number of batches in the dataset.
Epoch:
Batch:
Iteration:
Example:
If you have 1,000 training samples and a batch size of 100, then:
- Each epoch has 10 iterations (1,000 ÷ 100 = 10)
- After 10 iterations, the model completes one epoch
To Explore Machine Learning in Depth, Check Out Our Comprehensive Machine Learning Online Training To Gain Insights From Our Experts!
Overfitting and Underfitting
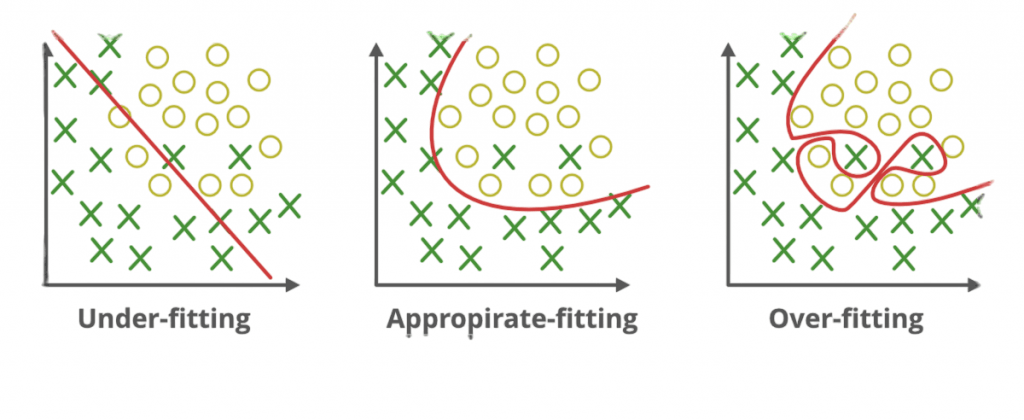
In machine learning, overfitting and underfitting are common problems that affect a model’s ability to generalize to new, unseen data.
Overfitting :occurs when a model learns the training data too well, including its noise and random fluctuations. As a result, the model performs exceptionally on the Bagging vs Boosting in Machine Learning data but poorly on test or real-world data because it fails to generalize. Overfitting often happens with very complex models or when the training dataset is small or not representative.
Underfitting : on the other hand, happens when a model is too simple to capture the underlying patterns in the training data. The model performs poorly on both the training data and new data because it hasn’t learned enough from the data. Underfitting usually results from using overly simplistic algorithms or insufficient training.
- How to Identify:
- Overfitting: High accuracy on training data but low accuracy on validation/test data.
- Underfitting: Low accuracy on both training and validation/test data.
- Overfitting solutions: Use regularization techniques (L1, L2), reduce model complexity, gather more data, use dropout, or apply early stopping.
- Underfitting solutions: Increase model complexity, train longer, use better features, or reduce regularization.

Selecting the Right Number of Epochs
There is no universally correct number of epochs. The ideal number depends on factors such as those discussed in Top Machine Learning Algorithms .
- Dataset size and complexity
- Model architecture
- Learning rate
- Batch size
Here are some common strategies to determine a suitable number:
- Start with a baseline (e.g., 10–100 epochs)
- Use a validation set to monitor performance
- Apply early stopping (discussed below)
- Plot training and validation loss curves
In practice, it’s common to:
- Use a higher epoch count with early stopping
- Experiment with different values through cross-validation
Looking to Master Machine Learning? Discover the Machine Learning Expert Masters Program Training Course Available at ACTE Now!
Monitoring Model Performance
Monitoring model performance is a crucial step in the machine learning lifecycle to ensure that models continue to deliver accurate and reliable predictions over time. It involves evaluating how well a trained model performs on new, unseen data and tracking key metrics that reflect its effectiveness. Common performance metrics vary depending on the task. For classification problems, metrics like accuracy, precision, recall, F1-score, and ROC-AUC are widely used, especially in various Applications of Artificial Intelligence For regression tasks, mean squared error (MSE), mean absolute error (MAE), and R-squared are typical. Selecting appropriate metrics aligned with business goals and problem context is essential.Beyond initial evaluation, continuous monitoring during deployment helps detect issues such as model drift, where the statistical properties of input data change over time, causing model performance to degrade. Monitoring allows teams to identify when retraining or updating the model is necessary.Tools and platforms like TensorBoard, MLflow, and cloud-based monitoring services provide dashboards and alerts that simplify tracking metrics, visualizing trends, and managing model versions.
Early Stopping Technique
Early stopping is a regularization technique that terminates training when the model’s performance on a validation dataset begins to degrade. This prevents overfitting and saves training time.
How it works:
- Monitor validation loss after each epoch.
- If validation loss increases (or doesn’t decrease) for a certain number of epochs (called “patience”), training is stopped.
- The model with the best validation loss is restored.
- from tensorflow.keras.callbacks import EarlyStopping
- early_stopping = EarlyStopping(monitor=’val_loss’, patience=5, restore_best_weights=True)
- model.fit(X_train, y_train, epochs=100, validation_split=0.2, callbacks=[early_stopping])
This approach ensures the model doesn’t continue training beyond the point of optimal generalization.
Preparing for Machine Learning Job Interviews? Have a Look at Our Blog on Machine Learning Interview Questions and Answers To Ace Your Interview!
Visualization Tools
Visualization tools are essential for understanding data, diagnosing model behavior, and communicating insights effectively. They help translate complex data and model results into intuitive visual formats like graphs, charts, and interactive dashboards.
Some popular visualization tools include:
- Matplotlib: A foundational Python library for creating static, animated, and interactive plots. It’s highly customizable and widely used for exploratory data analysis.
- Seaborn: Built on top of Matplotlib, Seaborn simplifies the creation of attractive statistical graphics with fewer lines of code. It excels at visualizing distributions and relationships between variables.
- Plotly: A powerful library for creating interactive, web-based visualizations. Plotly supports complex charts like 3D plots, heatmaps, and dashboards that can be embedded in websites or notebooks, making it a valuable skill in the Data Science Career Path.
- TensorBoard: Developed for TensorFlow, TensorBoard is a visualization toolkit that tracks and displays metrics such as loss and accuracy during model training, as well as embeddings, histograms, and computational graphs.
- Tableau & Power BI: Commercial platforms offering user-friendly drag-and-drop interfaces to build interactive dashboards and reports, widely used in business intelligence.
Using the right visualization tools helps data scientists detect patterns, identify anomalies, Monitoring Model Performance, monitor training progress, and present results clearly to stakeholders.
Summary
An epoch is a foundational concept in machine learning that represents a full pass through the training data. Understanding epochs,Role in Training Neural Networks, Epoch in Machine Learning Training , Monitoring Model Performance along with batch size and iterations, is crucial to fine-tuning your model’s training process.Machine learning relies heavily on high-quality data and effective training processes. Concepts like epochs, batches, and iterations define how models learn from data, while understanding overfitting and underfitting helps optimize model accuracy and generalization. Image annotation plays a critical role in supervised learning by providing labeled data essential for tasks in computer vision. Ensuring quality control in annotation and addressing the challenges and limitations of the annotation process improve dataset reliability. Monitoring model performance through relevant metrics and tools helps maintain model effectiveness in real-world scenarios. Finally, visualization tools such as Matplotlib, Seaborn, and TensorBoard aid in interpreting data, diagnosing models, and communicating insights clearly.