Last updated on 20th Mar 2025| 6832
- Introduction to Azure Monitor
- Key Features of Azure Monitor
- How Azure Monitor Works
- Metrics vs Logs in Azure Monitor
- Application Insights in Azure Monitor
- Integrating Azure Monitor with Other Azure Services
- Security and Compliance in Azure Monitor
- Pricing and Cost Considerations
- Azure Monitor vs AWS CloudWatch
- Setting Up Alerts and Notifications in Azure Monitor
- Performance Optimization Using Azure Monitor
- Common Issues and Troubleshooting in Azure Monitor
- Conclusion
Introduction to Azure Monitor
Azure Monitor is a comprehensive and unified monitoring service provided by Microsoft Azure to ensure the performance and health of your applications, infrastructure, and services. It collects, analyzes, and acts on telemetry data from Azure and on-premises environments to help maintain applications’ and workloads’ health, performance, and availability. Azure Monitor provides the necessary insights to proactively detect, diagnose, and resolve issues, enabling organizations to maintain operational efficiency. Azure Monitor integrates with various Azure services and offers tools to monitor virtual machines, applications, networks, and more. It plays a crucial role in observability, offering real-time monitoring, alerting, and dashboard creation capabilities, and seamlessly integrates into the broader Azure ecosystem.
Key Features of Azure Monitor
- Metrics and Logs Collection: Azure Monitor collects performance data, application logs, and system logs to give you detailed insights into your applications and infrastructure operation.
- Application Insights: It is an advanced monitoring tool specifically designed for web applications. It helps developers understand application behavior, diagnose issues, and improve performance.
- Alerts and Notifications: Azure Monitor allows you to set up custom alerts based on specific metrics or events, and notifications can be configured to send emails and messages or trigger automated actions.
- Dashboards: Custom dashboards can visualize metrics and logs, allowing users to track the health of their applications and resources in real-time.
- Autoscale: Azure Monitor can trigger auto scaling actions based on predefined metrics rules, ensuring that your services remain performant and cost-efficient.
- Log Analytics: Using the Log Analytics workspace, Azure Monitor collects and analyzes log data, offering advanced search capabilities and visualizations to identify trends, anomalies, and areas that need improvement.
- Integration with Azure Services: It integrates deeply with Azure services like Azure Security Center, Azure Automation, and Azure Application Gateway for end-to-end monitoring of your applications and infrastructure.
- Diagnostic Tools: Azure Monitor offers diagnostic tools such as diagnostic settings, log streams, and insights to troubleshoot and fix issues quickly.
Azure Monitor provides a comprehensive set of features to support the monitoring and managing resources across various environments. Some of the key features include:
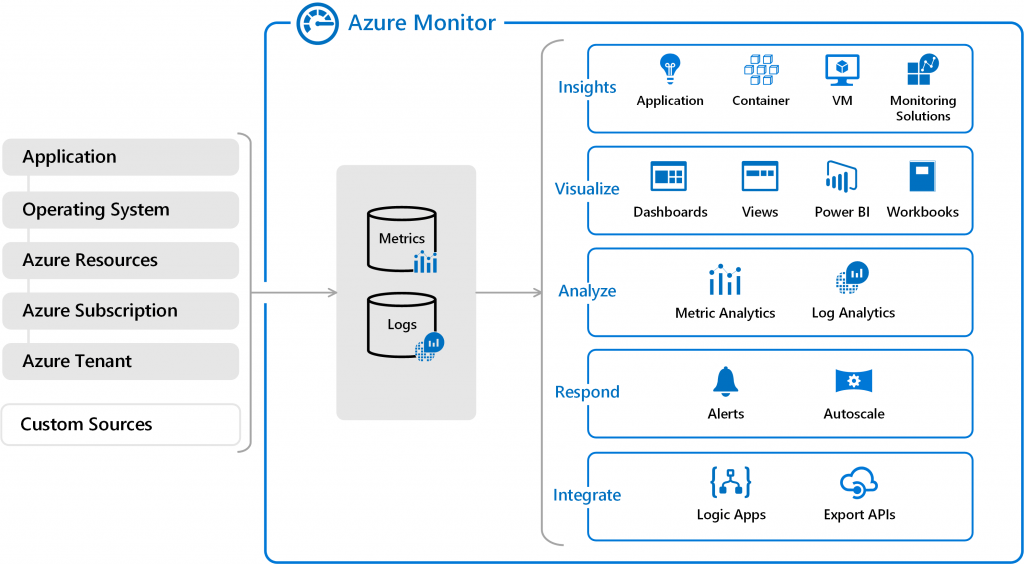
How Azure Monitor Works
Azure Monitor collects telemetry data from Azure resources, applications, and workloads using various components to ingest and analyze data. This allows for effective monitoring, visualization, and alerting based on the information gathered. It collects different types of data, such as metrics (numeric data points reflecting resource performance or health), logs (detailed records of events and system behavior), and diagnostic data (information from Azure resources about performance, security, and resource utilization). Data is ingested from multiple sources, including Azure resources like Virtual Machines, App Services, on-premises servers, and external environments via agents, SDKs, APIs, or streaming tools. After ingestion, Azure Monitor processes the data, aggregating metrics and parsing logs to extract valuable insights. It uses built-in queries or machine learning models for anomaly detection and generates alerts when thresholds are reached. These alerts can trigger actions, such as sending notifications, executing Azure Automation runbooks, or integrating with other services. Additionally, data is visualized through custom dashboards, charts, and graphs, enabling real-time tracking of trends, resource utilization, and performance. This comprehensive monitoring and analysis empower users to make informed decisions and ensure optimal performance across their Azure environments.
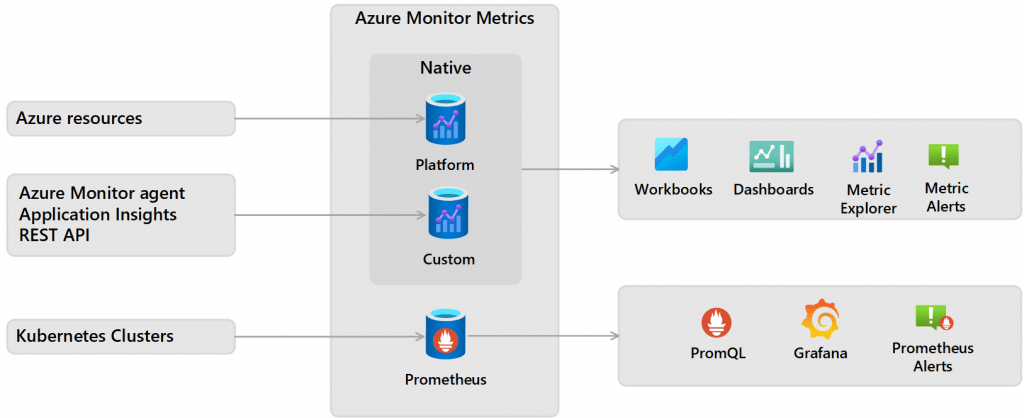
Metrics vs Logs in Azure Monitor
- Definition: Metrics are numerical data points that represent the state of a resource at a specific point in time. For example, the CPU utilization of a virtual machine or the number of requests processed by a web app.
- Characteristics: Metrics are typically collected at frequent intervals (e.g., every minute) and represent the health or performance of resources.
- Use Cases: Metrics are used for real-time monitoring, triggering alerts, and visualizing system performance over time.
- Definition: Logs are records of events that provide a detailed and structured account of activities, errors, or transactions within applications and services.
- Characteristics: Logs are typically unstructured or semi-structured and provide detailed information about actions, errors, and system events. They are collected at less frequent intervals and contain more granular, detailed information than metrics.
- Use Cases: Logs are helpful for troubleshooting, debugging, and conducting deep-dive analysis of application behavior, security events, and operational issues.
Azure Monitor uses two key types of telemetry data: metrics and logs. Both are vital for monitoring, but they serve different purposes:
Metrics:
Logs:
While metrics are useful for quick insights into resource health, logs provide more detailed information necessary for diagnostics.

Application Insights in Azure Monitor
Application Insights is a key feature of Azure Monitor, specifically designed to monitor web applications and services, providing developers with valuable insights into application performance and identifying potential issues or bottlenecks. It collects telemetry data, including user activity, request rates, response times, failure rates, dependencies, exceptions, and performance counters. The performance monitoring feature enables real-time tracking of an application’s performance, highlighting areas where the application may be slow or unresponsive. Additionally, dependency tracking provides insight into external services, such as databases and APIs, helping to identify bottlenecks that could affect overall performance. The application map visualizes the interactions between components and dependencies, allowing users to quickly identify issues. Furthermore, smart detection powered by machine learning automatically detects anomalies or performance problems and alerts users to take corrective actions. Ideal for cloud-native applications, microservices, and services running on Azure, Application Insights ensures optimal performance and reliability across your applications.
Integrating Azure Monitor with Other Azure Services
- Azure Automation: Azure Monitor integrates with Automation to trigger automated actions when an alert is fired, such as patching servers, scaling services, or restarting applications.
- Azure Logic Apps: Use Logic Apps to create workflows triggered by alerts in Azure Monitor. For example, you can send alerts via email or integrate with third-party applications.
- Azure Service Health: Integrate with Service Health to monitor the health of Azure services and get notifications about any planned maintenance or service issues.
- Azure Sentinel: Combine the capabilities of Azure Monitor with Azure Sentinel to enhance your security monitoring using centralized data from logs, metrics, and alerts.
Azure Monitor integrates well with other Azure services to provide a unified experience for monitoring applications, infrastructure, and services. Some key integrations include: Azure Security Center: Provides security insights by monitoring security configurations and recommend
Security and Compliance in Azure Monitor
Azure Monitor is built with security and compliance at its core, offering multiple features that help organizations maintain a secure and compliant environment. Role-Based Access Control (RBAC) allows for granular control over who can view and manage monitoring data, ensuring that access is restricted based on roles within the organization. Additionally, audit logs track administrative and operational changes in Azure resources, which are crucial for meeting regulatory compliance requirements. Azure Monitor ensures the security of sensitive data by encrypting it both in transit and at rest. It also adheres to various industry standards and compliance certifications, such as GDPR, ISO 27001, and SOC 2, making it suitable for organizations with stringent regulatory needs. Furthermore, security alerts can be configured to detect abnormal behavior, unauthorized access, or potential vulnerabilities, helping organizations take proactive measures to mitigate risks.
Pricing and Cost Considerations
- Metrics: You pay for the volume of metrics collected and the number of data points analyzed.
- Logs: Logs are charged based on the amount of log data ingested, stored, and queried.
- Application Insights: Pricing for Application Insights is based on the amount of telemetry data collected, stored, and analyzed.
- Alerting: Alerts can incur additional costs based on the number of alerts triggered and the volume of notifications sent.
- Data Retention: Data is retained for a default period (e.g., 30 days for logs). Longer retention may incur additional charges.
- Additional Costs: Integrations with other Azure services, such as Azure Automation, Azure Logic Apps, and Azure Event Grid, may also result in additional costs based on usage.
Azure Monitor follows a consumption-based pricing model, where you pay for the data you ingest, store, and query. Pricing factors include:
Azure Monitor vs AWS CloudWatch
Azure Monitor and AWS CloudWatch serve similar functions in monitoring cloud environments, but they differ in several key areas. Azure Monitor is specifically tailored for the Azure ecosystem, providing deep integrations with Azure services, while AWS CloudWatch is optimized for monitoring AWS resources. In terms of pricing, Azure Monitor charges based on data ingestion and retention, whereas AWS CloudWatch offers multiple pricing tiers, including a free-tier service. Both platforms offer rich feature sets, with Azure Monitor integrating well with Azure Automation and Azure Sentinel, while AWS CloudWatch has seamless integrations with AWS services such as Lambda and EC2. The user interfaces also differ: Azure Monitor features a centralized interface that enables users to manage resources across the entire Azure platform, while CloudWatch offers an interface that is more focused on Amazon-centric services. Despite these differences, both tools provide robust monitoring capabilities to support the operations and management of cloud environments.
Setting Up Alerts and Notifications in Azure Monitor
- Create an Alert Rule: Define conditions based on metrics or logs (e.g., CPU utilization exceeding 80%) and evaluation frequency.
- Set Action Groups: Configure actions, including sending emails, triggering automated processes with Azure Automation, or invoking Azure Functions.
- Define Notification Channels: Choose from various channels, such as email, SMS, or webhook, to notify the right stakeholders about critical issues.
Azure Monitor allows you to configure alerts based on metrics, logs, and diagnostic data. To set up alerts:
Performance Optimization Using Azure Monitor
Azure Monitor provides actionable insights to help optimize the performance of both applications and infrastructure. To achieve optimal performance, first, identify bottlenecks by using tools like Application Insights and Log Analytics, which pinpoint areas where your applications or resources may be underperforming. Next, configure auto-scaling rules that dynamically adjust resources based on real-time performance metrics, ensuring your applications can handle fluctuations in load without manual intervention. Additionally, optimize queries using Log Analytics to monitor resource usage and fine-tune resource allocation, helping to reduce unnecessary costs. Tracking essential performance metrics such as response times, failure rates, and CPU utilization allows you to identify areas for improvement. By continuously analyzing these insights, businesses can enhance their application performance, improve user experience, and maintain efficient resource management.
Common Issues and Troubleshooting in Azure Monitor
- Check Data Ingestion: Ensure that the telemetry data is being ingested correctly by Azure Monitor, and troubleshoot any data delays.
- Review Alerts: Check the alert conditions to ensure they are triggering at the correct thresholds and adjusting for false positives.
- Optimize Queries: Review query performance and adjust them for efficiency by limiting data scopes and time ranges.
- Examine Resource Usage: Investigate the performance of monitored resources through metrics and logs to identify system constraints.
Common challenges in Azure Monitor include data delays, alert misconfigurations, and query performance issues. To troubleshoot:
Conclusion
Azure Monitor is an essential tool for organizations leveraging Azure services, offering a comprehensive solution for monitoring the performance, health, and availability of applications and infrastructure. With its robust features such as metrics and logs collection, Application Insights, advanced alerting, and integration with other Azure services, it provides actionable insights that help businesses optimize their operations. Security and compliance capabilities ensure that organizations can maintain a secure and compliant environment, while its flexible pricing model allows for scalability. By integrating Azure Monitor with Azure Automation, Logic Apps, and other tools, organizations can automate responses and ensure that their systems are always performing optimally. Whether you’re looking to troubleshoot issues, optimize performance, or scale your applications efficiently, Azure Monitor is a critical component of modern cloud management.