Last updated on 19th Mar 2025| 5824
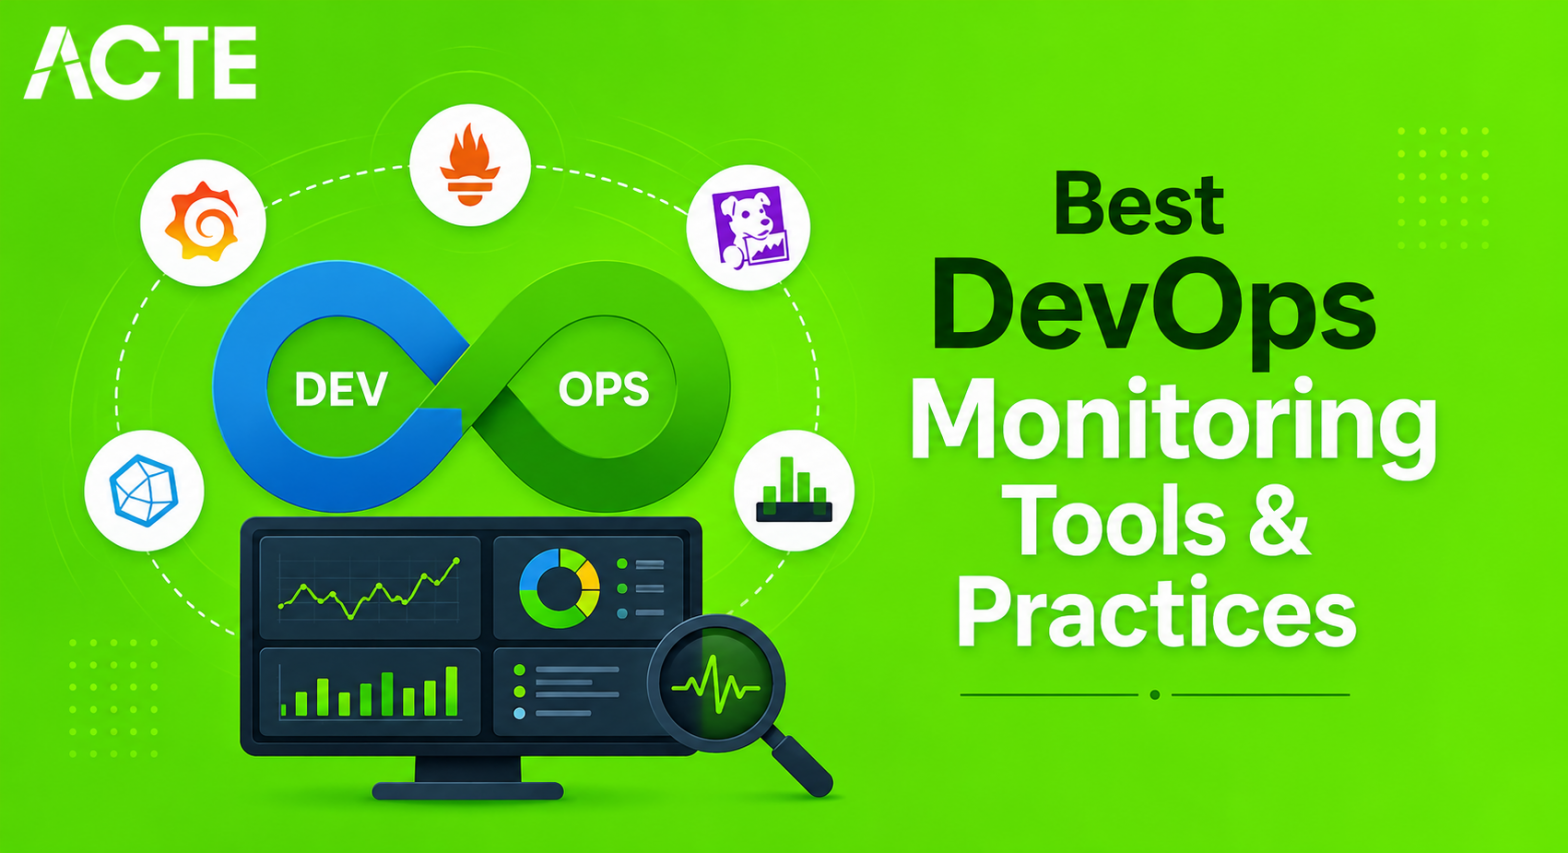
- Introduction to DevOps Monitoring
- Importance of Monitoring in DevOps
- Types of DevOps Monitoring
- Popular DevOps Monitoring Tools
- Log Management and Analysis
- Performance Monitoring Tools
- Cloud Monitoring and Incident Response Solutions
- Challenges in DevOps Monitoring
- Best Practices for DevOps Monitoring
- Conclusion
Introduction to DevOps Monitoring
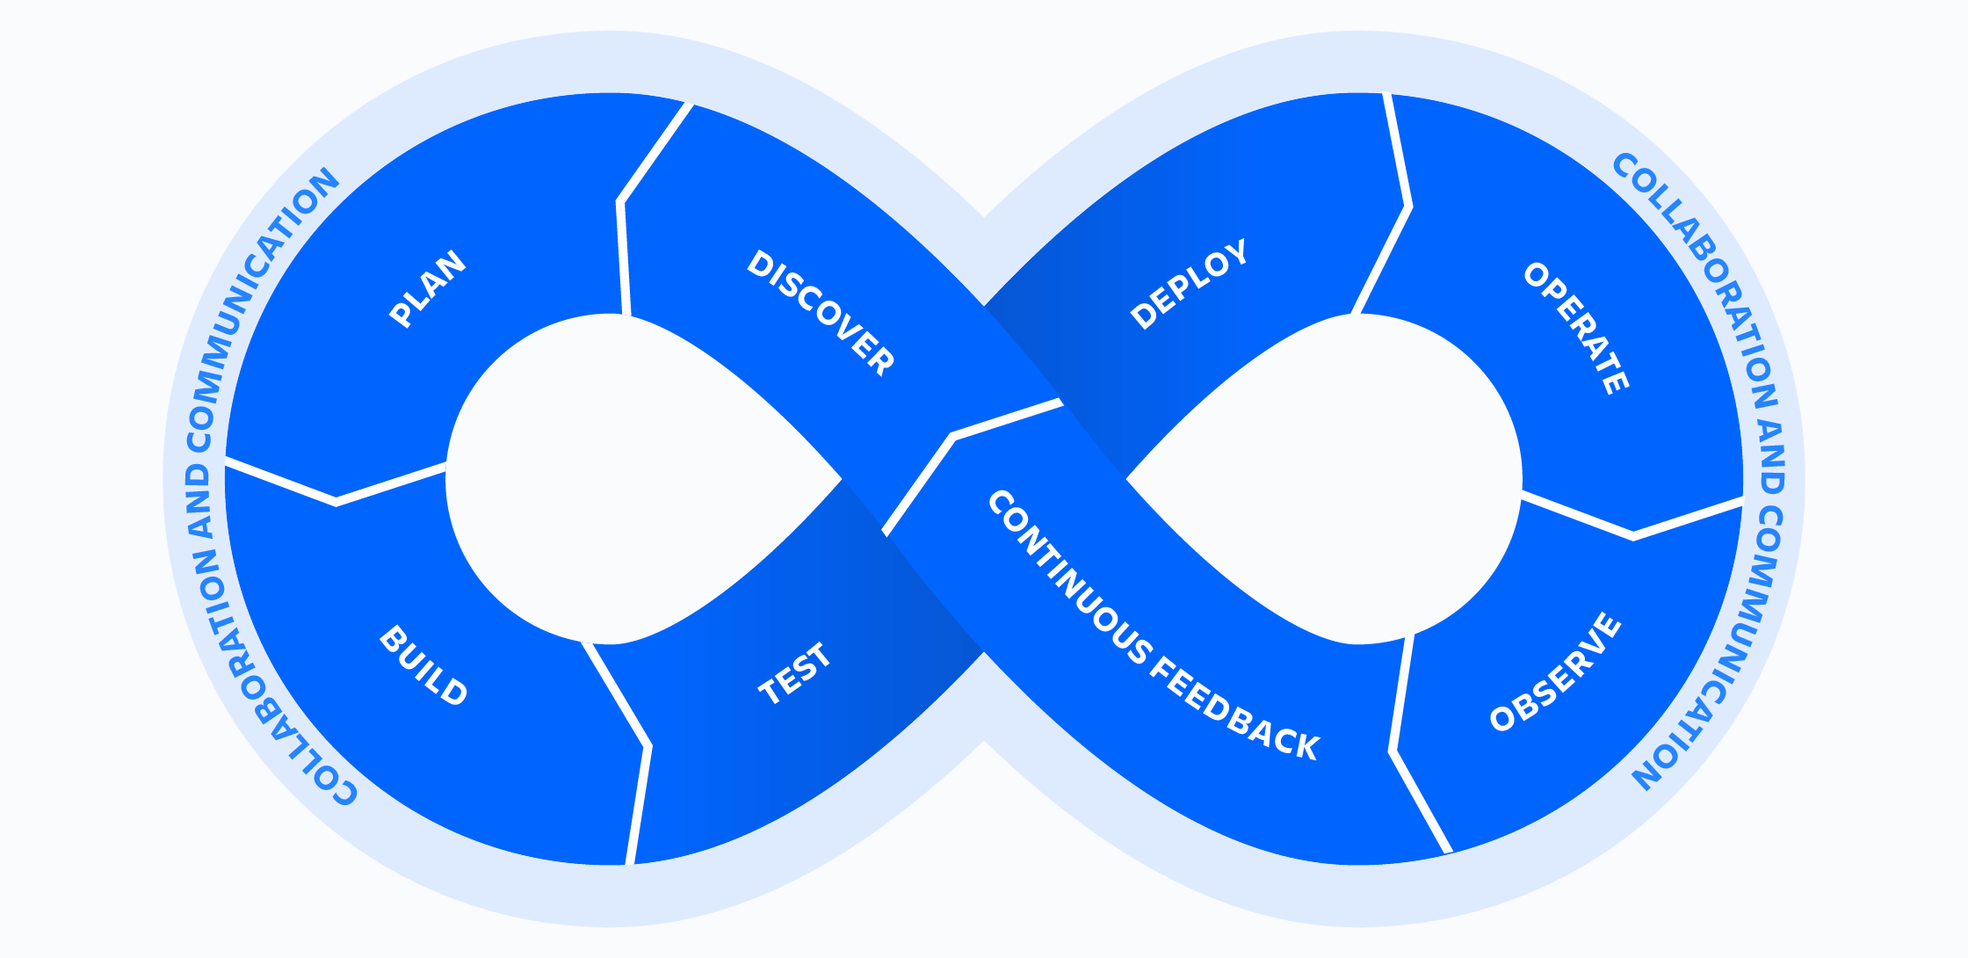
DevOps monitoring is a crucial aspect of the DevOps lifecycle, focused on tracking and optimizing the performance, security, and reliability of systems and applications. As DevOps aims to integrate development and operations teams, monitoring ensures that all parts of the development cycle, from code development to deployment and maintenance, are operating efficiently. Effective monitoring empowers teams to proactively detect issues, identify bottlenecks, and ensure real-time system stability. Devops Training and monitoring span multiple application lifecycle stages, from infrastructure management to application performance. DevOps monitoring is indispensable in ensuring the reliability and performance of modern applications, especially as organizations increasingly adopt agile methodologies and continuous integration/continuous delivery (CI/CD) pipelines. In this article, we will explore the importance of monitoring in DevOps, different types of monitoring, popular tools, and best practices.
Importance of Monitoring in DevOps
- Proactive Issue Detection: Continuous tracking helps identify issues before they escalate, ensuring proactive problem-solving.
- Operational Visibility: Monitoring provides visibility into the health and performance of the entire system, from the infrastructure level to individual application components.
- Faster Troubleshooting: DevOps teams can rapidly respond to incidents by pinpointing failures or performance issues and minimizing downtime.
- Continuous Improvement: Performance metrics, when integrated with Devops Lifecycle Tools, help teams identify inefficiencies and areas for improvement in code, infrastructure, or processes, contributing to continuous improvement.
- Automation and Optimization: Monitoring feeds critical data to automated systems, enabling the optimization of infrastructure and application performance based on real-time insights.
- Enhanced Collaboration: Continuous monitoring fosters collaboration between development, operations, and security teams, which is central to the DevOps culture.
Types of DevOps Monitoring
Infrastructure Monitoring
Infrastructure monitoring focuses on tracking the underlying infrastructure’s health, performance, and capacity, including servers, virtual machines, containers, and networks. It provides insights into system health, availability, and resource utilization (CPU, memory, disk space, and network traffic).
Key Metrics:
- CPU and memory usage
- Disk I/O
- Network traffic and latency
- Server uptime and availability
Application Monitoring
Application monitoring tracks the application’s performance to ensure that it performs as expected. It focuses on code execution, application response times, error rates, end-user experience, and Effective Load Balancing.
Key Metrics:
- Response time and latency
- Error rates
- Transaction throughput
- Database query performance
Eager to Acquire Your Devops Certification? View The Devops Training Offered By ACTE Right Now!
Security Monitoring
Security monitoring in DevOps is essential to protect against cyber threats. It involves tracking vulnerabilities, monitoring security events, and protecting sensitive data. This includes identifying abnormal behavior that may indicate a breach, unauthorized access, or malware.
Key Metrics:
- Authentication and access logs
- Vulnerabilities and patching status
- Threat detection and response times
- Intrusion detection
Business Monitoring
Business monitoring focuses on monitoring the business KPIs (Key Performance Indicators) and user behavior within applications. This includes tracking conversion rates, user engagement, revenue, and other business outcomes, and can be efficiently implemented using Amazon Web Services Devops tools and practices.
Key Metrics:
- Conversion rates
- User activity and engagement
- Revenue generation
- Customer retention and churn rate
Popular DevOps Monitoring Tools
Various tools are available for DevOps monitoring, each serving different purposes in the lifecycle. Some of the most popular tools include:
- Prometheus: Prometheus is an open-source monitoring and alerting toolkit designed for reliability and scalability. It is best known for its use in Kubernetes and microservices architectures. Prometheus collects time-series data and provides a flexible query language (PromQL) to analyze the data.
- Grafana : Grafana is an open-source data visualization and monitoring platform. It integrates with Prometheus and many other data sources to provide rich, interactive dashboards that make it easier to visualize performance data.
- Datadog: Datadog is a SaaS-based monitoring and analytics platform that provides a comprehensive solution for monitoring cloud infrastructure, applications, logs, Aws Auto Scaling, and more. It is commonly used to monitor complex, distributed systems.
- New Relic : New Relic offers end-to-end application performance monitoring. It provides insights into application performance, including transaction times, error rates, and database queries. It is popular in monitoring the health of cloud-native applications.
- AppDynamics AppDynamics offers end-to-end application performance management (APM), focusing on monitoring code-level performance, application behavior, and user experience. It is widely used in enterprise environments for complex application monitoring.
- Dynatrace Dynatrace is an AI-powered application monitoring platform that offers comprehensive observability of application performance, infrastructure health, and user experience. It is known for providing automated root-cause analysis and insights into the entire stack.
- Data Overload: Monitoring generates a vast amount of data. Handling and analyzing this data in real time can be challenging.
- Integration Complexity: Integrating various monitoring tools and platforms can be complex and time-consuming.
- Alert Fatigue: Too many alerts can lead to fatigue, where teams ignore or miss critical notifications.
- Scalability: As systems grow, scaling monitoring solutions to meet the needs of large, distributed environments can be challenging.
- False Positives & Negatives: Incorrect alerts can either cause unnecessary panic (false positives) or fail to catch real issues (false negatives).
- Lack of End-to-End Visibility: Monitoring across Cloud Native Microservices, containers, and cloud environments makes it hard to get a complete picture of system health.
- Cost Management: Monitoring at scale can become expensive due to data storage, computation, and licensing fees for monitoring tools.
- Security & Compliance: Ensuring monitoring data is secure and compliant with regulations (e.g., GDPR, HIPAA) can be a challenge.
- Latency in Issue Detection: Delays in detecting and responding to issues can lead to downtime and impact user experience.
- Customization & Fine-Tuning: Configuring monitoring tools to capture relevant metrics without excessive noise requires effort and expertise.
Features: Time-series data collection, Built-in alerting capabilities, Integration with Grafana for visualization, Kubernetes-native monitoring.
Excited to Obtaining Your Devops Certificate? View The Devops Training Offered By ACTE Right Now!
Features: Real-time dashboards, Integration with various data sources (e.g., Prometheus, Elasticsearch), Customizable visualizations, Alerts and notifications.
Features: Infrastructure and application monitoring, Log management and analysis, Real-time anomaly detection, Integrations with over 400 services.
Features: Real-time application performance monitoring, Distributed tracing Full-stack monitoring, Integration with cloud platforms (AWS, Azure, GCP)

Log Management and Analysis
Effective log management is a core component of DevOps monitoring. Log data provides critical insights into system and application behavior, allowing teams to detect anomalies, troubleshoot issues, and improve application performance. Popular log management solutions include, The ELK stack is a widely used open-source toolset for managing and analyzing logs. It enables the collection, processing, and visualization of log data. Elasticsearch searches and indexes logs, Logstash processes log data, and Kibana provides visualization capabilities. The Features are Real-time log search and analysis, Centralized log management, Visual dashboards, Scalable and customizable. Splunk is a powerful log management platform that provides real-time data monitoring and analysis. It is commonly used for machine data and offers features like indexing, searching, and analyzing log data from various sources. The features are real-time log analysis, alerts and reports, machine learning-driven insights, scalable architecture, and Devops Training.
Performance Monitoring Tools
Monitoring application performance is key to ensuring an optimal user experience. Tools such as New Relic, AppDynamics, and Dynatrace focus on tracking application performance.
Features : Real-time application monitoring, Business transaction monitoring, Database and infrastructure monitoring, Root-cause diagnostics.
Features : Full-stack monitoring (applications, infrastructure, logs), AI-driven root-cause analysis, Distributed tracing, Real-time performance monitoring.
Cloud Monitoring and Incident Response Solutions
As organizations migrate to the cloud, adopting cloud-specific monitoring tools is essential for maintaining the health and performance of cloud resources. AWS CloudWatch provides monitoring and observability for AWS services, offering metrics collection, log management, customizable alarms, and seamless integration with AWS Lambda. Similarly, Azure Monitor delivers full-stack monitoring for Azure applications, featuring real-time resource monitoring, performance insights, log analytics, and auto-scaling capabilities. Google Cloud Stackdriver offers visibility into Google Cloud applications, supporting logging, error tracking, service-level metrics, and integration with other GCP services, and is a key component covered in Google Cloud Certifications. Proactive alerting and incident response are critical for maintaining system reliability. PagerDuty automates incident management by integrating with monitoring tools to deliver real-time alerts, manage on-call scheduling, and ensure swift response to minimize downtime. Likewise, Opsgenie, part of the Atlassian suite, enhances incident management by offering alerting, seamless monitoring tool integration, on-call scheduling, and post-incident reporting. With these cloud monitoring and incident response tools, businesses can enhance operational efficiency, quickly detect issues, and maintain service reliability across cloud environments.
Devops Master’s Degree in Cloud Computing? Enroll For Devops Master Certification Today!
Challenges in DevOps Monitoring
Set to Ace Your Devops Job Interview? Check Out Our Blog on Devops Interview Questions & Answer
Best Practices for DevOps Monitoring
Centralized Monitoring: Use centralized monitoring platforms to consolidate data from various sources for easier management.
Automate Responses: Implement automated response mechanisms to reduce human intervention and improve incident response time.
Real-time Dashboards: Use interactive dashboards for real-time system and application performance visibility.
Define Key Metrics: Focus on key metrics that align with business goals and performance objectives to avoid unnecessary complexity.
Integrate Monitoring with CI/CD:Integrate monitoring into your CI/CD pipelines for real-time visibility and faster issue detection.
Conclusion
DevOps monitoring ensures modern applications’ performance, security, and reliability. It provides real-time insights into the health of systems, applications, and infrastructure, enabling organizations to detect and address issues before they affect users. By utilizing the proper monitoring tools, such as application performance monitoring (APM), log management, and infrastructure monitoring, teams can gain visibility into every application stack layer. This helps identify bottlenecks, potential security vulnerabilities, and performance degradation. Adopting best practices in Devops Training and monitoring, such as implementing automated alerts, continuous integration/continuous delivery (CI/CD) pipelines, and proactive incident response, ensures that teams can quickly respond to problems. This improves uptime and enhances operational efficiency by reducing manual intervention. Additionally, teams can continuously improve software quality and performance by integrating monitoring with feedback loops. Organizations can deliver high-quality software faster, minimize downtime, and maintain a seamless user experience with adequate monitoring. In the fast-paced world of modern software development, DevOps monitoring is indispensable for achieving agility, reliability, and security.