
Last updated on 10th Mar 2025| 6678
- Introduction to ELK Stack
- Components of ELK: Elasticsearch, Logstash, and Kibana
- How ELK Stack Works
- Installing and Configuring ELK Stack
- Future Trends and Enhancements in ELK
- Indexing and Searching with Elasticsearch
- Security and Access Control in ELK
- Scaling and Performance Optimization
- Use Cases of ELK in Different Industries
- Comparison of ELK with Other Logging Solutions
- Conclusion
Introduction to ELK Stack
The ELK Stack is a robust open-source set of tools that enables the collection, indexing, search, analysis, and visualization of large volumes of data, particularly logs and metrics. It is commonly used in DevOps, IT operations, security monitoring, and business intelligence to gain insights from data across different sources and systems. The stack has three main components Elasticsearch, Logstash, and Kibana. These components work together to provide a seamless real-time experience for managing and analyzing log and event data. As organizations generate vast amounts of data from their applications, infrastructure, and users, the Cloud Computing Course enables the ingestion, indexing, and analysis of this data to derive meaningful insights and ensure efficient IT operations management. In this guide, we will explore the components of the ELK Stack, how it works, and its use cases in different industries. We will also cover installation, configuration, and scaling considerations and compare ELK with other logging solutions.
Components of ELK: Elasticsearch, Logstash, and Kibana
-
Elasticsearch
- Full-text search: Elasticsearch can quickly search through large datasets and provide search results with high performance and relevance.
- Distributed nature: Elasticsearch can horizontally scale to handle vast amounts of data by distributing it across multiple nodes.
- Real-time indexing: Data ingested into Elasticsearch is indexed in Essential Cloud Computing Tools and Beyond , ensuring that search queries can access the most up-to-date data.
Elasticsearch is the core search and analytics engine in the ELK Stack. It is a distributed, RESTful search engine based on the open-source Apache Lucene project. It is designed for full-text search, real-time indexing, and distributed computing. Elasticsearch is designed to handle large volumes of unstructured and structured data, making it ideal for search and analytics use cases.
-
Logstash
- Data transformation: Logstash allows you to process, filter, and enrich data before sending it to Elasticsearch. This enables users to normalize and structure raw data for more meaningful analysis.
- Plugins: Logstash is extensible and supports various plugins for inputs, filters, and outputs. This flexibility allows organizations to integrate with different data sources and destinations. Kibana
- Dashboards and visualizations: Kibana enables users to create customized dashboards with various visualizations, such as bar charts, line graphs, pie charts, and maps.
- Data exploration: Kibana’s powerful query and filtering capabilities allow users to drill down into their data and explore trends, patterns, and anomalies.
- Alerting and monitoring: Kibana integrates with other ELK components to enable monitoring and alerting based on specified thresholds, ensuring proactive issue management.
Logstash is the ELK Stack’s data collection and transformation pipeline. It is designed to ingest, transform, and forward data to Elasticsearch (or other outputs) for indexing and analysis. Logstash supports various input sources, including log files, databases, message queues, and metrics.
Kibana is the visualization layer of the ELK Stack. It provides an intuitive user interface for interacting with Elasticsearch and visualizing data. Kibana helps users gain insights from indexed data through Ansible Playbooks Explained Guide, charts, and graphs.
Start your journey in Cloud Computing by enrolling in this Cloud Computing Online Course .
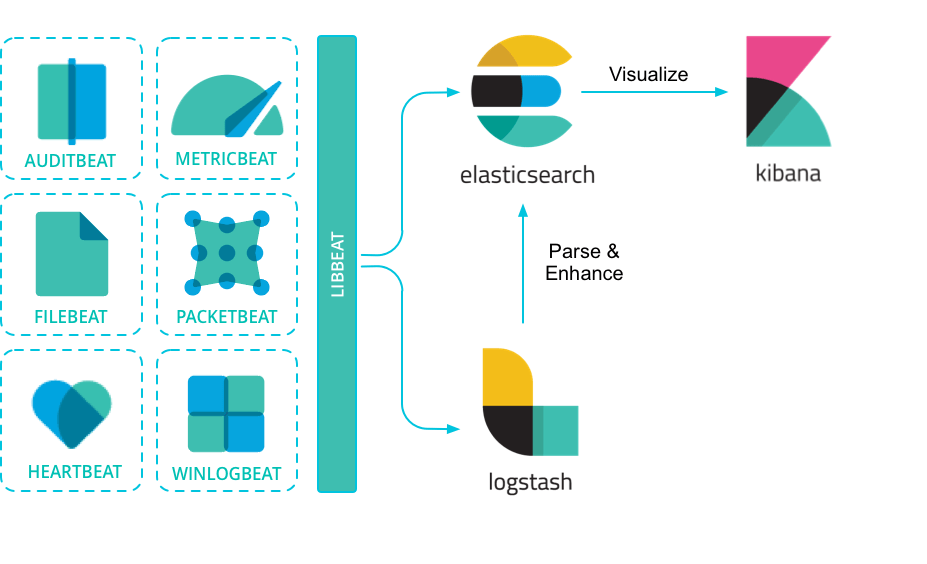
How ELK Stack Works
The ELK Stack collects, processes, and visualizes data from various sources, following a structured workflow. Data ingestion is the first stage, where information is collected using Logstash or Beats, a lightweight data shipper. Logstash is ideal for handling large volumes of data and performing pre-processing before sending it to Elasticsearch, while Beats offers specialized shippers like Filebeat for log files and Metricbeat for system metrics. These tools gather log and event data from servers, applications, and services. Once ingested, data undergoes processing and transformation in Logstash, where it is filtered, parsed, and enriched using plugins. Cloud Computing Coursestage ensures data consistency by extracting relevant fields, converting timestamps, and adding metadata such as geographic details or user-agent information. The processed data is then sent to Elasticsearch, where it is indexed for efficient storage and retrieval. Elasticsearch automatically creates indexes based on predefined mappings or data types, optimizing search performance for real-time queries. Finally, indexed data can be explored and visualized in Kibana, which provides a user-friendly web interface for creating dashboards and visualizations. Kibana enables users to analyze logs, monitor system performance, and detect security threats through custom queries, making the ELK Stack a comprehensive solution for data-driven insights.
Installing and Configuring ELK Stack
- A Linux or Windows server (Elasticsearch and Logstash can run on Linux, Windows, and macOS).
- Java 8 or higher (required by Elasticsearch).
- Sufficient system resources, such as memory and storage, depending on your expected workload.
- Elasticsearch: Download and install Elasticsearch from the official website or use package managers like APT (Ubuntu/Debian) or YUM (CentOS/RedHat).
- Logstash: Similarly, install Logstash from the official website or package managers.
- Kibana: Install Kibana on the same server as Elasticsearch or a separate machine, depending on your architecture.
- Elasticsearch: Modify the configuration file (elasticsearch.yml) to configure the network host, cluster name, and index settings.
- Logstash: You can Configure Logstash by editing its configuration files (log stash.conf). Ansible Playbooks Explained Guide includes specifying input sources, filters, and output destinations.
- Kibana: Configure Kibana to connect to your Elasticsearch cluster by editing the kibana.yml configuration file.
- Indexing: When data is ingested into Elasticsearch, it is organized into indices, which act as logical data stores. Each index is made up of multiple documents, which are JSON objects containing structured and unstructured data. These documents consist of various fields that hold specific pieces of information. Elasticsearch automatically indexes the data in real-time, making it instantly searchable. This real-time indexing ensures that newly added data is available for querying without delays, making Elasticsearch ideal for applications requiring immediate insights, such as logging, analytics, and monitoring systems.
- Search Queries: Elasticsearch offers a highly flexible and robust search mechanism through its RESTful API. It supports a wide range of search operations, from simple full-text searches to complex aggregations. Users can filter, sort, and group data based on various criteria using the Query DSL (Domain-Specific Language). Features like fuzzy searching, phrase matching, and relevance scoring enhance search accuracy. Additionally, Elasticsearch supports geo-based queries, enabling location-based searches essential for applications such as mapping and logistics.
- Scaling Elasticsearch: Elasticsearch is designed with horizontal scalability in mind, meaning it can expand by adding more nodes to a cluster. Seamless Cloud Migration Guide architecture allows for seamless scaling as data volume grows. Elasticsearch uses sharding to divide indices into smaller shards, distributing them across different nodes to optimize search performance. Additionally, replication ensures that copies of the data are stored on multiple nodes, providing high availability and fault tolerance. This distributed nature makes Elasticsearch highly resilient, ensuring continuous operation even in cases of hardware failures. Organizations handling large datasets, such as e-commerce platforms, cybersecurity firms, and business intelligence applications, benefit significantly from Elasticsearch’s scalability and efficiency.
- Sharding and Replication: One of the most critical aspects of scaling Elasticsearch is the use of sharding and replication. Sharding allows Elasticsearch to break large datasets into smaller, more manageable pieces (shards), which are then distributed across multiple nodes in a cluster. This enhances query performance and prevents bottlenecks. Replication, on the other hand, ensures data redundancy and fault tolerance by creating copies of primary shards. If a node fails, the replicated shard on another node takes over, ensuring data availability and system resilience. Properly configuring the number of shards and replicas is essential for balancing search speed, indexing performance, and fault tolerance.
- Cluster Management: As the ELK Stack scales, effective cluster management is crucial to maintaining stability and efficiency. Administrators should continuously monitor cluster health using Elasticsearch’s built-in monitoring tools, which provide insights into node performance, disk space usage, query latency, and Hybrid Cloud Hypervisors for Scalability. Adjusting configurations such as heap size, indexing rate, and cache settings can optimize performance as the workload increases. Load balancing is another key factor in scaling—distributing traffic evenly across nodes prevents overloading a single component, ensuring smooth operations.
- Cost: One of ELK Stack’s biggest advantages is its open-source nature, which allows organizations to deploy and use it without expensive licensing fees. While commercial alternatives like Splunk offer robust features, they come with significant costs based on data ingestion volume, storage, and additional enterprise features. In contrast, ELK allows businesses, especially startups and small-to-medium enterprises, to set up a powerful log management system at a lower total cost of ownership. However, it’s important to note that while the core ELK components are free, organizations may still incur expenses related to infrastructure, maintenance, and support, especially when scaling.
- Flexibility: ELK Stack offers a high degree of customization through its configuration and plugins. Users can tailor the ingestion pipeline, processing rules, and visualization dashboards to meet specific business needs. Logstash, for example, supports numerous input, filter, and output plugins that enable seamless integration with different data sources and storage solutions. While alternatives like Understanding Arns in AWS and Loggly provide pre-built functionalities that simplify setup and management, they may not offer the same level of customization. Organizations that require fine-tuned data processing or integration with specific tools often find ELK more adaptable.
- Scalability: ELK Stack is designed for horizontal scalability, meaning that as data volume increases, organizations can distribute the workload across multiple nodes, ensuring high availability and performance. Elasticsearch, the core search engine, is built to handle distributed data storage and processing efficiently, making ELK a great choice for large-scale deployments. On the other hand, some commercial solutions like Splunk require additional infrastructure or enterprise-level features to scale effectively, often leading to higher costs. ELK’s ability to scale dynamically makes it well-suited for growing businesses and enterprises with large, evolving data needs.
Prerequisites: Before installing the ELK Stack, ensure that the following prerequisites are met:
Installation: To install the ELK Stack, you can follow these general steps:
Configuration: Once installed, you need to configure the components:
Starting Services: Once the components are configured, start the Elasticsearch, Logstash, and Kibana services. Ensure that Elasticsearch is running and accessible before starting the other components.
Learn how to manage and deploy cloud services by joining this Cloud Computing Online Course today.
Future Trends and Enhancements in ELK
The ELK Stack is continuously evolving, incorporating new features to enhance its capabilities and meet the growing demands of modern data analytics. One significant trend is the integration of machine learning, enabling advanced anomaly detection and predictive analytics. By leveraging machine learning, ELK can automatically identify patterns, detect irregularities in log data, and provide proactive insights, making it a valuable tool for security monitoring, fraud detection, and system performance optimization. Another major advancement is its improved cloud-native support. With organizations increasingly adopting cloud-based infrastructures, ELK is focusing on seamless integration with major cloud platforms such as AWS, Azure, and Google Cloud Platform (GCP). AWS S3 CLI Efficient Cloud Storage ensures better scalability, cost efficiency, and ease of deployment in cloud environments. Additionally, the ELK Stack is prioritizing simplified management to enhance user experience. Efforts are being made to streamline setup and maintenance through automated configuration, improved orchestration, and enhanced user interfaces. These improvements make it easier for organizations to manage large-scale deployments, reducing operational complexity and increasing efficiency. With these advancements, ELK continues to solidify its position as a powerful and versatile solution for real-time log analysis, security intelligence, and business insights, catering to a wide range of industries and use cases.
Indexing and Searching with Elasticsearch

Security and Access Control in ELK
Security is a key concern when handling large volumes of sensitive data, and the ELK Stack includes several features to secure access and protect information. Elasticsearch provides robust security features such as encryption, role-based access control (RBAC), and authentication. By utilizing Elastic Security (formerly X-Pack), organizations can configure security settings like user authentication, authorization, and audit logging to monitor and control access. These features help safeguard data from unauthorized access while ensuring compliance with security policies. Kibana also plays a crucial role in securing the ELK Stack by allowing administrators to configure roles and permissions for accessing dashboards and other features. Unlocking Scalability with Cloud Native Tech security functionalities integrate seamlessly with Elasticsearch’s RBAC system, enabling precise user access management to data and visualizations. By implementing these security measures, organizations can restrict access based on user roles, ensuring that only authorized personnel can view, edit, or analyze sensitive data. Furthermore, enabling encrypted communications and audit logging enhances the overall security posture, protecting against potential breaches and unauthorized modifications. With these security mechanisms in place, the ELK Stack provides a secure and reliable solution for organizations handling critical business and operational data, ensuring both data protection and compliance with industry standards.
Aspiring to lead in Cloud Computing? Enroll in ACTE’s Cloud Computing Master Program Training Course and start your path to success!
Scaling and Performance Optimization
As the volume of data grows, the ELK Stack must be scaled efficiently to handle increased load while maintaining performance and reliability. The ELK Stack is designed for horizontal scalability, meaning that additional nodes can be added to distribute data processing and storage more effectively. Proper scaling ensures that the system can continue to index, search, and analyze data in real-time without performance degradation.
Additionally, scaling Logstash and Kibana is equally important. Logstash should be optimized by using multiple pipeline workers and distributed processing nodes to handle large data ingestion rates. Kibana should be configured to work efficiently with Elasticsearch, ensuring dashboards remain responsive even as data volume increases.
Use Cases of ELK in Different Industries
The ELK Stack has a wide range of use cases across various industries, making it a versatile tool for data ingestion, processing, and visualization. In the field of DevOps, ELK plays a crucial role in log aggregation, monitoring, and troubleshooting, helping teams maintain application stability and quickly identify performance issues. Security professionals leverage ELK for real-time security monitoring, threat detection, and incident response, allowing organizations to detect anomalies and mitigate potential risks before they escalate. In the Understanding Azure Kubernetes Service, ELK helps businesses analyze user behavior, track sales trends, and gain insights into operational data, enabling data-driven decision-making to enhance customer experiences and optimize sales strategies. Additionally, IT operations teams benefit from ELK’s capabilities in infrastructure monitoring, performance analysis, and capacity planning, ensuring seamless system performance and resource allocation. With its scalability, flexibility, and integration capabilities, the ELK Stack has become an essential tool for organizations seeking to harness the power of real-time data analysis. Its ability to process large volumes of data efficiently makes it a go-to solution for businesses aiming to improve operational efficiency, security, and overall performance across various domains.
Preparing for Cloud Computing interviews? Visit our blog for the best Cloud Computing Interview Questions and Answers!
Comparison of ELK with Other Logging Solutions
The ELK Stack competes with various logging and monitoring solutions such as Splunk, Graylog, and Loggly, each offering unique features and advantages. However, ELK distinguishes itself through its cost-effectiveness, flexibility, and scalability, making it an appealing choice for many organizations.
Conclusion
The ELK Stack comprising Elasticsearch, Logstash, and Kibana is a powerful open-source solution for ingesting, processing, searching, and visualizing data. Its flexibility, scalability, and strong community support make it a popular choice for organizations seeking real-time insights from log and event data. Elasticsearch, the core of the stack, provides a distributed search and analytics engine capable of handling vast amounts of structured and unstructured data. Logstash acts as a data processing pipeline, efficiently collecting, transforming, and forwarding data to Elasticsearch. Kibana then enables users to visualize and analyze the indexed data through intuitive dashboards and charts. One of the key advantages of the Cloud Computing Course is its ability to handle high-velocity data streams, making it ideal for security monitoring, application performance analysis, and business intelligence. Additionally, its extensive plugin ecosystem and integration capabilities with cloud platforms and third-party services enhance its usability across different industries.