Last updated on 18th Mar 2025| 6540
- Introduction to Amazon QuickSight
- Key Features and Capabilities of Amazon QuickSight
- Benefits of Using Amazon QuickSight for Business Intelligence
- Getting Started with Amazon QuickSight
- Connecting Data Sources in Amazon QuickSight
- Creating and Customizing Dashboards
- Understanding Visualizations and Charts in Amazon QuickSight
- Using Amazon QuickSight ML Insights for Data Analysis
- Sharing and Collaborating on Reports
- Pricing and Cost Considerations
- Comparing Amazon QuickSight with Other BI Tools
- Best Practices for Effective Data Visualization
Introduction to Amazon QuickSight
Amazon QuickSight is a fast, cloud-powered business intelligence (BI) service from Amazon Web Services (AWS). It enables organizations to analyze and visualize their data, gain insights, and make data-driven decisions. QuickSight allows users to easily create interactive dashboards, reports, and visualizations without managing infrastructure or complex setups. It integrates seamlessly with other AWS services, making it ideal for businesses already utilizing the AWS ecosystem or those undergoing Amazon Web Services Training. QuickSight’s scalable architecture can handle many use cases, from small-scale business analytics to enterprise-level, big-data visualization. It supports machine learning-powered insights, ad-hoc querying, and multi-tenant dashboards, providing a robust and flexible BI tool for businesses of all sizes.
Key Features and Capabilities of Amazon QuickSight
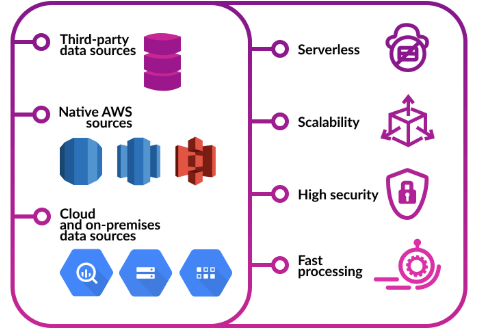
Amazon QuickSight offers several key features that make it a powerful BI tool:
- Data Connectivity: QuickSight can connect to various data sources, including Amazon S3, Amazon Redshift, Amazon RDS, AWS IoT Analytics, and on-premises databases. It supports structured and semi-structured data, enabling users to analyze various data types.
- Interactive Dashboards: Users can create dynamic dashboards that allow them to interact with the data in real time. These dashboards offer various visualization options, from simple charts to advanced geospatial visualizations.
- ML-Powered Insights: Amazon QuickSight incorporates machine learning algorithms to identify patterns and trends in your data automatically. These insights help users understand data more deeply and gain valuable predictions.
- AutoGraph Feature: QuickSight’s Autograph feature automatically suggests the most relevant types of visualizations based on the underlying data, making it easier for users to create meaningful charts with minimal effort.
- SPICE Engine: The Super-fast, Parallel, In-memory Calculation Engine (SPICE) is QuickSight’s proprietary technology that enables fast, scalable, and interactive data analysis. SPICE allows users to perform high-speed queries on large datasets, including those from Amazon Redshift, improving performance and response time.
- Customizable Visualizations: QuickSight supports various visualizations, including bar charts, line graphs, scatter plots, heat maps, pie charts, and geographical maps. Users can tailor these visualizations to suit their needs.
- Embedded Analytics: QuickSight provides capabilities for embedding dashboards and reports into other applications, allowing businesses to offer analytics functionality within their platforms.
- Collaboration: QuickSight enables sharing dashboards and reports with team members and stakeholders. It supports scheduled email reports so that users can receive automated updates regularly.
- Security: QuickSight integrates with AWS Identity and Access Management (IAM) for user authentication and access control. It also supports data encryption at rest and in transit, ensuring the protection of sensitive data.
Excited to Achieve Your AWS Certification? View The AWS Online course Offered By ACTE Right Now!
Benefits of Using Amazon QuickSight for Business Intelligence
- Cost Efficiency: Amazon QuickSight offers a pay-per-session pricing model, meaning you only pay for actual usage. This makes it affordable for businesses of all sizes. There are no upfront costs, and users only pay when they interact with the dashboards or reports, helping organizations optimize costs.
- Scalability: QuickSight can scale from small business analytics to enterprise-level deployments. It leverages AWS infrastructure to automatically scale as needed, without any manual intervention, ensuring that performance remains consistent even with large datasets.
- Ease of Use: QuickSight’s user-friendly interface simplifies the process of creating and customizing reports and dashboards. It’s suitable for technical and non-technical users, as no advanced data skills are required to use it effectively.
- Data-Driven Insights: With Machine Learning Techniques capabilities, QuickSight helps users gain valuable insights by identifying patterns, trends, and anomalies in data. This empowers organizations to make better, more informed decisions.
- Security and Compliance: As part of the AWS ecosystem, QuickSight benefits from AWS’s robust security features. This includes data encryption, role-based access control, and compliance with industry standards and certifications such as GDPR, HIPAA, and SOC 2.
- Seamless AWS Integration: For businesses already using other AWS services, QuickSight integrates smoothly with tools like Amazon Redshift, AWS RDS, S3, and more, providing a seamless experience for importing, analyzing, and visualizing data.
- Collaboration and Sharing: QuickSight allows users to collaborate by sharing reports and dashboards across teams. It also includes setting up scheduled reports to be emailed to recipients, ensuring that stakeholders are updated.
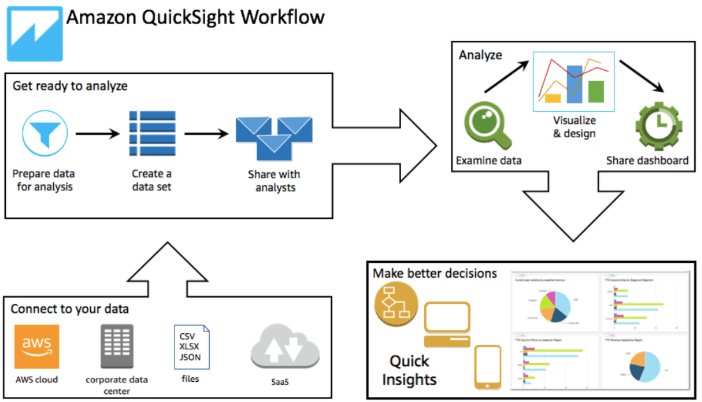
Getting Started with Amazon QuickSight
Getting started with Amazon QuickSight is straightforward. First, sign up for an AWS account if you don’t already have one, as QuickSight is part of the AWS ecosystem. Once logged in, navigate to the QuickSight service page and enable it for your account, selecting your preferred data storage region. Next, choose an edition based on your needs either the Standard Edition for small teams or the Enterprise Edition for larger organizations requiring advanced features. After that, connect your data sources, including AWS services like S3, Redshift, and RDS, or upload files from your local system and on-premises sources. Once your data is connected, you can create your first dashboard using QuickSight’s intuitive drag-and-drop interface to build visualizations. Finally, customize your dashboard with filters, interactivity, and various visualization styles, and share it with your team or embed it in an application.
Thrilled to Achieve Your AWS Certification? View The AWS Online Training Offered By ACTE Right Now!
Connecting Data Sources in Amazon QuickSight
Amazon QuickSight supports connecting to various data sources, enabling users to create comprehensive visualizations from multiple data points. Some familiar data sources include:
- Amazon S3: You can connect to data stored in Amazon S3 buckets, including CSV, JSON, and Parquet files.
- Amazon Redshift: QuickSight integrates with Amazon Redshift, AWS’s data warehousing service, enabling users to create advanced data visualizations from large datasets stored in Redshift clusters.
- Amazon RDS: QuickSight can connect to relational databases hosted on Amazon RDS, including MySQL, PostgreSQL, Oracle, and SQL Server.
- AWS IoT Analytics: QuickSight also integrates with AWS IoT Analytics to analyze data streams and generate real-time insights.
- On-premises Data: The QuickSight desktop client securely connects users to on-premises data sources like SQL databases, providing a hybrid solution.
- Third-party Sources: QuickSight can also connect to third-party data sources via JDBC connectors, providing flexibility for businesses using various databases.

Creating and Customizing Dashboards
Amazon QuickSight allows users to create interactive dashboards with various customization options. To begin, select “New Analysis” from the QuickSight console, choose your dataset, and start building visualizations. You can add different chart types, including bar charts, line charts, pie charts, and geographical maps, with QuickSight’s AutoGraph feature automatically suggesting the most suitable visualization based on your data. To enhance interactivity, customize filters, drop-downs, and parameters, enabling users to explore data from different perspectives. Additionally, you can adjust the layout and design by resizing and repositioning visual elements and modifying colors and fonts to match your branding. QuickSight, as covered in AWS Training , also supports custom calculations and metrics, allowing you to create calculated fields and aggregates to refine your analysis further.
Interested in Pursuing AWS Master’s Program? Enroll For AWS Master Course Today!
Understanding Visualizations and Charts in Amazon QuickSight
Amazon QuickSight offers a variety of visualizations to help users interpret and analyze data:
- Bar and Column Charts: Used to display quantities across different categories.
- Line and Area Charts: Ideal for showing trends over time.
- Pie and Donut Charts: These are useful for showing proportions and percentages.
- Heatmaps: Used to visualize the correlation between two variables using color gradients.
- Geospatial Visualizations: QuickSight supports maps and geographical data visualizations, allowing users to view data on a map.
- Tables: For displaying data in tabular format, with the option to sort, filter, and highlight specific rows or columns.
Using Amazon QuickSight ML Insights for Data Analysis
One of QuickSight’s standout features is its machine learning (ML) capabilities, enabling advanced data analysis without requiring data science expertise. QuickSight ML Insights helps businesses uncover valuable insights by identifying anomalies, detecting trends, and predicting future outcomes. The detection feature automatically highlights unusual patterns in data, allowing users to spot irregularities effortlessly. With forecasting, QuickSight analyzes historical data to generate predictions about future trends, aiding in strategic decision-making.
Preparing for Your AWS Interview? Check Out Our Blog on AWS Interview Questions & Answer
Sharing and Collaborating on Reports
Once you’ve created dashboards in Amazon QuickSight, you can easily share them with colleagues and stakeholders. QuickSight supports the following collaboration features:
- Sharing Dashboards: You can share dashboards via email, directly within QuickSight, or by embedding them in your internal applications.
- Scheduled Reports: QuickSight allows you to schedule reports to be emailed to recipients regularly, ensuring that stakeholders are updated.
- Access Control: You can set permissions and roles to control who can view or modify your dashboards.
Pricing and Cost Considerations
Amazon QuickSight follows a pay-per-session pricing model, where costs depend on user access and data usage. User pricing is based on the number of users accessing dashboards and reports, with different pricing tiers for Standard and Enterprise users. SPICE capacity costs are determined by the amount of data stored and analyzed within QuickSight’s in-memory engine. Additionally, extra charges may apply for data queries or exporting large datasets. To optimize costs, organizations can limit user access, manage SPICE capacity efficiently, and monitor usage regularly.
Comparing Amazon QuickSight with Other BI Tools
When compared to traditional BI tools like Tableau, Power BI, and Qlik, Amazon QuickSight offers:
- Lower Cost: The pay-per-session model and integration with Top AWS Services make QuickSight a cost-effective solution.
- Seamless AWS Integration: QuickSight integrates better with AWS data services, offering a more streamlined experience for AWS users.
- Scalability: The SPICE engine allows QuickSight to scale quickly without requiring extensive infrastructure setup.
Best Practices for Effective Data Visualization
AWS Training Leverage filters and parameters to allow users to interact with the data and customize their view. Maintain consistency in color schemes and layouts for better readability and a professional look. Finally, test and iterate by gathering feedback from end-users and refining dashboards to enhance usability and effectiveness.