Last updated on 09th Apr 2025| 6740
- Introduction to AWS CloudWatch
- How Does AWS CloudWatch Work?
- Key Features of AWS CloudWatch
- AWS CloudWatch Metrics
- AWS CloudWatch Alarms
- AWS CloudWatch Logs
- AWS CloudWatch Dashboards
- AWS CloudWatch Events
- Advantages of AWS CloudWatch
- Use Cases of AWS CloudWatch
- How to Set Up AWS CloudWatch
- Conclusion
Introduction to AWS CloudWatch
Amazon Web Services (AWS) CloudWatch is a comprehensive and versatile monitoring and observability service that enables organizations to monitor, collect, and analyze real-time operational data from AWS resources, applications, and on-premises systems. With AWS CloudWatch, you can effectively track the performance of your AWS infrastructure, gain valuable insights into operational efficiency, and respond proactively to any issues or performance degradation. The service allows users to monitor key metrics, logs, and events from various AWS services such as EC2, RDS, Lambda, and S3, alongside on-premises servers and applications. This broad monitoring capability gives organizations in-depth visibility into their entire AWS environment, making it easier to ensure high availability and optimize resource utilization, key topics covered in Amazon Web Services Training. Additionally, CloudWatch enhances the security of AWS applications by providing timely insights into potential security threats or anomalies. By offering this level of visibility and control, AWS CloudWatch helps businesses maintain a responsive and efficient cloud infrastructure, improving both performance and security while reducing the risks of downtime or inefficiency.
Interested in Obtaining Your AWS Certificate? View The AWS Certification Training Offered By ACTE Right Now!
How Does AWS CloudWatch Work?
AWS CloudWatch gathers and organizes data from various sources in real-time, including metrics, logs, and events. It works seamlessly with other AWS services, allowing you to visualize, monitor, and respond to changes in your AWS environment.
- Metrics: CloudWatch collects data on various metrics (e.g., CPU utilization, disk reads/writes, network traffic) from AWS resources and custom applications.
- Logs: CloudWatch allows you to aggregate logs from AWS services and applications. This feature helps you troubleshoot issues by analyzing logs in real time.
- Alarms: You can create alarms based on metrics or logs to receive notifications or trigger automated actions when specific thresholds are breached, a feature that can be integrated with the Guide to AWS Connect for enhanced customer service management.
- Events: CloudWatch can capture events and system changes within your environment, such as an EC2 instance scaling up or down.
- Real-time Monitoring: CloudWatch provides real-time monitoring of AWS resources and applications, helping you track system performance and troubleshoot problems as they occur.
- Custom Metrics: In addition to AWS-provided metrics, CloudWatch allows you to create custom metrics to track application-specific data that is not available out of the box.
- Log Collection and Management: CloudWatch enables centralized log collection, making it easier to store, search, and analyze logs across multiple services.
- Dashboards: CloudWatch provides customizable dashboards that allow you to visualize the metrics that matter most to your business in a unified view, which can complement AWS S3 CLI Efficient Cloud Storage management.
- Alarms and Notifications: CloudWatch enables you to create alarms that notify you when predefined thresholds are breached, helping you take immediate action to mitigate potential issues.
- Automated Responses: CloudWatch integrates with other AWS services to trigger automated actions, such as scaling EC2 instances, stopping/starting instances, or executing Lambda functions when alarms are triggered.
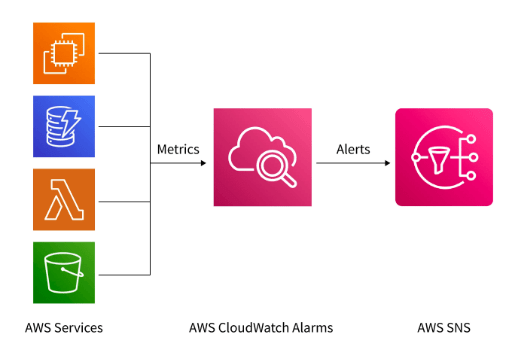
- Monitor Metrics: CloudWatch Alarms track specific metrics over a defined period and trigger actions when predefined thresholds are exceeded.
- Send Notifications: Alarms can send alerts via Amazon SNS (Simple Notification Service) to notify users about potential issues.
- Trigger Auto Scaling: CloudWatch Alarms can automatically scale resources up or down based on changing demand to maintain performance, which can also support seamless migrations with AWS Database Migration Service DMS.
- Invoke AWS Lambda Functions: Alarms can trigger AWS Lambda functions to automate responses to specific conditions or events.
- Track Multiple Metrics: Alarms can be configured to monitor a wide range of metrics, such as CPU usage, disk space, memory utilization, and custom application metrics.
- Automate Actions: CloudWatch Alarms help automate operational tasks, such as resource scaling or issue notifications, improving the efficiency of cloud management.
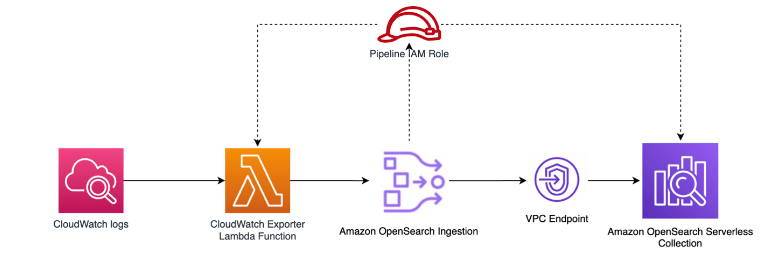
- Collect and Store Logs: AWS CloudWatch Logs enables the collection, storage, and analysis of log data from AWS resources and on-premises servers.
- Centralize Log Data: It aggregates logs from various AWS services like EC2, Lambda, and API Gateway, as well as on-premises applications, consolidating them in one location for easy access.
- Log Filtering: CloudWatch Logs allows users to filter logs, making it easier to identify specific events or issues within the log data, a capability that can be integrated with Exploring AWS CodeCommit for enhanced version control and troubleshooting.
- Search Logs Efficiently: With CloudWatch Logs, you can quickly search through log data to pinpoint and troubleshoot problems.
- Advanced Log Analytics: CloudWatch Logs Insights provides a powerful tool for querying and analyzing log data, enabling deeper insights and more effective troubleshooting.
- Real-time Log Monitoring: CloudWatch Logs offers real-time log monitoring, allowing you to detect issues as they happen and take immediate action.
- Proactive Issue Detection: By monitoring logs in real-time, CloudWatch helps detect issues proactively, reducing downtime and improving application performance.
- Comprehensive Monitoring: CloudWatch monitors various AWS resources and custom metrics, providing in-depth visibility into your environment.
- Scalability: As your environment grows, CloudWatch can scale automatically to handle the increased volume of metrics, logs, and events, a feature that complements Amazon Lightsail Uncovered Simplified Cloud Hosting.
- Automation: The service allows you to automate responses to issues and performance changes, reducing manual intervention and improving operational efficiency.
- Cost-Effective: AWS CloudWatch follows a pay-as-you-go pricing model, ensuring you only pay for the metrics, logs, and alarms you use.
- Security: CloudWatch integrates with AWS Identity and Access Management (IAM) to control access to monitoring data, helping secure your resources.
- Access CloudWatch: In the AWS Management Console, navigate to the CloudWatch service.
- Create Custom Metrics: Define custom metrics to monitor application-specific data.
- Set Up Alarms: Create alarms for key metrics to receive notifications or trigger actions when thresholds are crossed, a strategy that can also help manage costs effectively, similar to Azure Virtual Network Pricing for optimizing network resources.
- Configure Log Streams: Set up log collection by configuring log streams from your Amazon Web Services resources or on-premises servers.
- Design Dashboards: Create dashboards to visualize key metrics, logs, and events that matter most to your organization.
- Automate with Events: Set up CloudWatch Events to automate responses to operational changes in your environment.
Key Features of AWS CloudWatch
AWS CloudWatch Metrics
CloudWatch Metrics are the core building blocks of AWS CloudWatch, offering time-ordered data points that represent the performance of various AWS resources and services. AWS CloudWatch automatically collects standard metrics from a wide range of AWS services, including EC2, RDS, Lambda, and S3. These metrics are organized into different namespaces, such as AWS/EC2 for EC2 instances or AWS/RDS for RDS instances, making it easy to identify and monitor specific services. These metrics provide essential insights for monitoring system performance, such as CPU usage, memory consumption, and network traffic, helping you track the health of your AWS resources, which can be integrated with Reliable & Scalable AWS CodeDeploy for CI/CD. They also offer valuable information on resource utilization, including disk space, read/write operations, and request counts, allowing you to assess capacity and optimize resource allocation. Additionally, CloudWatch enables the monitoring of custom application metrics, providing visibility into the performance of your applications. Users can also create custom metrics to capture data not available in the default AWS metrics, such as specific application events or metrics for on-premises resources, further enhancing monitoring capabilities.
AWS CloudWatch Alarms
Are You Interested in Learning More About AWS? Sign Up For Our AWS Certification Training Today!
AWS CloudWatch Logs

AWS CloudWatch Dashboards
CloudWatch Dashboards are customizable, graphical interfaces that provide a unified view of key performance indicators (KPIs) and critical metrics, allowing you to easily track the health and performance of your AWS resources. These dashboards are highly flexible and can be tailored to display the metrics that are most important to your specific application or service. They support multiple types of widgets, such as graphs, numbers, and text, to present data in meaningful ways, enabling you to visualize trends and monitor performance at a glance. CloudWatch Dashboards also allow for the integration of cross-service metrics, enabling you to display data from various AWS services and accounts in a single view, similar to how Azure Traffic Manager integrates and manages traffic across different regions. This centralized approach to monitoring provides you and your team with a comprehensive understanding of your environment’s performance, making it easier to identify issues and respond quickly to any changes or anomalies in your Amazon Web Services infrastructure.
Looking to Master AWS? Discover the AWS Masters Course Available at ACTE Now!
AWS CloudWatch Events
AWS CloudWatch Events is a powerful service that allows you to respond to state changes and operational events in your AWS environment. These events can include changes such as launching an EC2 instance, scaling up an Auto Scaling group, or modifying an IAM policy. CloudWatch Events enables you to set up automated actions triggered by specific events, allowing you to react quickly to changes in your infrastructure. For example, if an EC2 instance fails or becomes unhealthy, CloudWatch Events can trigger an alarm or automatically deploy a replacement instance to maintain availability. This service integrates seamlessly with other AWS tools like Lambda, SNS, and Step Functions, enabling you to automate responses across your environment. By leveraging CloudWatch Events, organizations can build event-driven architectures that automatically adjust to changes without manual intervention. This capability is essential for improving operational efficiency, reducing response time, and enhancing the overall reliability of cloud infrastructure, concepts often emphasized in AWS Training. CloudWatch Events plays a critical role in automating operational tasks and improving the agility of cloud-based applications.
Advantages of AWS CloudWatch
AWS CloudWatch offers numerous benefits that make it a key tool for monitoring and managing AWS resources and applications:
Use Cases of AWS CloudWatch
AWS CloudWatch is a versatile service that can be applied in various scenarios across industries to ensure optimal performance, security, and compliance. It enables performance monitoring by tracking the health and efficiency of applications and infrastructure. For cost optimization, CloudWatch helps monitor resource utilization, allowing you to adjust and ensure AWS resources are appropriately sized, reducing unnecessary expenses, similar to how Azure Data Studio helps manage and optimize database performance. In security monitoring, CloudWatch tracks security-related events and helps identify suspicious activity, such as unauthorized access attempts or changes to security groups. It also aids in troubleshooting by collecting logs and metrics, allowing teams to diagnose and resolve issues with applications, network configurations, and AWS resources. Additionally, CloudWatch supports compliance and auditing by gathering logs and data points necessary for audits, helping organizations meet regulatory requirements. With these features, AWS CloudWatch serves as an essential tool for monitoring, optimizing, and securing cloud environments across different industries.
How to Set Up AWS CloudWatch
Want to Learn About AWS? Explore Our AWS Interview Questions & Answer Featuring the Most Frequently Asked Questions in Job Interviews.
Conclusion
AWS CloudWatch is a crucial monitoring and observability tool for managing AWS resources and applications. It provides real-time metrics, logs, alarms, and events, giving organizations valuable insights to ensure optimal performance, security, and cost efficiency. By leveraging CloudWatch, businesses can proactively address operational issues, automate resource management, and monitor the health of their cloud-based applications. CloudWatch helps users track infrastructure performance, troubleshoot application issues, and gain deep insights into system operations, a critical skill covered in AWS Training. It also enables the creation of custom metrics and alarms, allowing businesses to set thresholds and receive alerts for any anomalies. Additionally, CloudWatch helps optimize costs by tracking resource utilization and providing actionable insights to reduce unnecessary expenses. Overall, AWS CloudWatch is an essential tool for maintaining a healthy, responsive, and efficient Amazon Web Services environment, making it easier for businesses to manage and scale their cloud operations while ensuring the best possible performance and reliability.