- Open the CloudWatch console at https://console.aws.amazon.com/cloudwatch/.
- In the navigation pane, choose Alarms, All alarms.
- Select Create alarm
- Select Select Metric.
- (Optional) If you have enabled cross-account functionality in the CloudWatch console and the current account is a monitoring account, select a different AWS account under Search Metrics that contains the metric you want to see the alarm for. For more information, see Cross-Account Cross-Region CloudWatch Console.
- Under Statistics, choose a statistic or a predefined percentile, or specify a custom percentile (for example, p95.45).
- Under Duration, select the evaluation period for the alarm. When evaluating an alarm, each period is aggregated into a single data point.
- You can also choose whether the y-axis legend appears to the left or right when creating an alarm. This preference is only used if you are creating an alarm.
- Enter a name and description for the alarm. The name must contain only ASCII characters.
- Whenever there is a metric for , specify whether the metric should be greater than, less than, or equal to the limit. Less than, specify a threshold value.
- Select Additional Configurations. For alarms from a datapoint, specify how many evaluation periods (data points) the alarm state must have in order for the alarm to be triggered. If the two values match here, you create an alarm that goes into the alarm state if it is violating multiple periods in a row.
- To create M from N alarms, specify a number less than that specified for the second value for the first value. For more information, see Evaluating alarms.
- For Missing data treatment, choose how the alarm behaves when certain data points are missing. For more information, see Configuring how CloudWatch deals with missing data alarms.
- If the alarm uses a percentile as the monitored figure, a percentage box with fewer samples appears. Use it to choose whether to evaluate or ignore cases with low sample rates. If you choose Ignore (maintain alarm state), the current alarm state is always maintained if the sample size is too small. For more information, see.
- Percentage-based Cloudwatch Alarms and Reduced Data Samples.
Select Next.
- Under Notification, choose an SNS topic to be notified when there is an alarm in the ALARM STATUS, OK STATUS, or INSUFFICIENT_DATA STATUS.
- To have an alarm send multiple notifications for the same alarm status or for different alarm conditions, select Add notification.
- To not send notifications to the alarm, select Remove.
- To have the alarm perform Auto Scaling, EC2, or System Manager actions, select the appropriate button and select the alarm status and action to perform. Alarm system managers can perform actions only when they go into the alarm state. For more information about System Manager actions, see Configuring CloudWatch to create OpsItems from alarm and event creation.
- Enter a name and description for the alarm. The name must contain only ASCII characters. Then choose Next.
- Under Preview and Create, confirm that the information and conditions are the ones you want, then select Create alarm.
To create an alarm based on a single metric:
Do one of the following:
Select the service namespace that contains the metric you want. Keep choosing options as they seem to limit the options. When the list of metrics appears, select the check box next to the metric you want. In the search box, enter the name of a metric, dimension, or resource ID, and press Enter. Then choose one of the results and continue until the list of metrics appears. Select the check box next to the metric you want.
Select the Graphing Metrics tab.
Select Select Metric.
The Specify Metrics and Terms page appears, showing a graph and other information about the metrics and statistics you selected. Under the conditions, specify the following:
When finished, select Next.
- To create an alarm using the CloudWatch console
- For example, see Creating an Amazon CloudWatch alarm in the Amazon CloudWatch User Guide
- To create an alarm using the Amazon EC2 console
- Open the Amazon EC2 console at https://console.aws.amazon.com/ec2/.
- In the navigation pane, select Instances.
- Select Example and choose Action, Monitor and troubleshoot, Manage CloudWatch alarms.
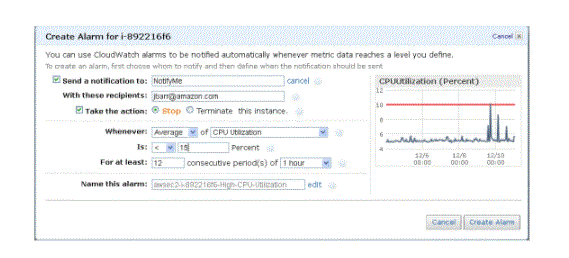
- On the Manage CloudWatch alarm details page, under Add or edit alarms, select Create alarm.
- For alarm notification, choose to turn the toggle on or off to configure Amazon Simple Notification Service (Amazon SNS) notifications. Enter an existing Amazon SNS topic or enter a name to create a new topic.
- For the alarm action, choose to turn the toggle on or off to specify the action to be taken when the alarm is triggered. Select an action from the dropdown.
- For Alarm Threshold, select Metric and Criteria for the alarm. For example, you can leave the default settings to group samples by (average) and sample by type of data (CPU usage). When for alarm, select >= and enter 0.80. For consecutive duration, enter 1. For Duration, choose 5 minutes.
- (Optional) For sample metric data, select Add to Dashboard.
- Select Create.
- You can edit your CloudWatch alarm settings from the Amazon EC2 console or the CloudWatch console. If you want to remove your alarm, you can do so from the CloudWatch console. For more information, see Editing or deleting a CloudWatch alarm in the Amazon CloudWatch User Guide.
Create a CloudWatch alarm for an instance:
You can create a CloudWatch alarm that monitors CloudWatch metrics for one of your instances. When the metric reaches the limit you specify, CloudWatch will automatically send you a notification. You can create a CloudWatch alarm using the Amazon EC2 console or by using the more advanced options provided by the CloudWatch console.
AWS CloudWatch is a service:
AWS CloudWatch is a service that allows you to monitor and manage applications and resources deployed within your AWS account and region. It includes tools that help you process and use logs from various AWS services to understand, troubleshoot, and optimise deployed services. I’m going to show you how to get an email when your lambda logs a certain number of events.
Set-up:
To follow this tutorial, you must have an AWS account setup. I’ve created a lambda function that logs a random number between 0 and 200 when run to simulate tracking the number of users subscribing to my system. I used serverless to deploy this lambda function to my AWS account. The Lambda function is triggered by a CloudWatch rule periodically to simulate the number of users subscribed for each minute.
- Here we see how to set up a custom metric filter using the CloudWatch Log from Lambda function. To follow these steps, you must have a Lambda set up, which sends logs to CloudWatch.
- Navigate to the CloudWatch console. You can find your logs by selecting Log Groups from the left vertical menu. The Log Groups page has an entry for each Lambda function, ECS function, and any other service instances that are logging into CloudWatch. The labels in the log group name indicate the AWS service and logging instances. Click the Log group to view the CloudWatch logs from that instance.
CloudWatch Metrics:
Tracked AWS service events called metrics can trigger alarms when the metric exceeds some predetermined threshold. Many AWS services produce metrics automatically, but you can also create custom metrics in your AWS services to track exactly what you need. See the CloudWatch User Guide for a list of automatically generated metrics.
You can create metric filters using data logged by AWS services like Lambda. Once the lambda logs are in cloudwatch, you can create a filter based on the observed data patterns for that function. Cloudwatch takes filters and converts the data into numerical metrics that can trigger alarms. Here I will show you how to build metrics on your logged data to track logged errors.
Step-by-Step : Create a Metric Filter
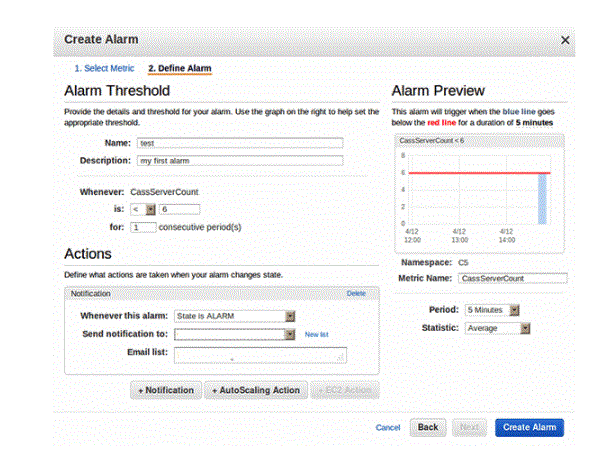
- Login to your AWS account and navigate to the AWS CloudWatch console. On this page, you choose the Alarms menu item from the left-hand menu, then press the orange Create Alarm button in the navigation pane.
- Next, AWS will take you to a page with a simple step-by-step process to create your alarm after pressing the Create Alarm button. There are four steps to complete. First, you have to choose which metric will trigger the alarm. Press the white Select Metric button to configure it.
- The Select Metrics page contains all the options for existing alarms, including the default metrics created by AWS. For lambdas, this includes metrics such as throttle rates, errors, and invocations. Some of the default metrics in most AWS services are available here.
- Since I created a custom metric filter in the previous section, I will select that metric to use for the alarm. Custom metrics are listed in the CloudWatch Metrics section under the Custom namespaces we created. Click on Subscriptions and then click on metrics with no dimensions to search for a filter for the username you created earlier.
CloudWatch Alarms:
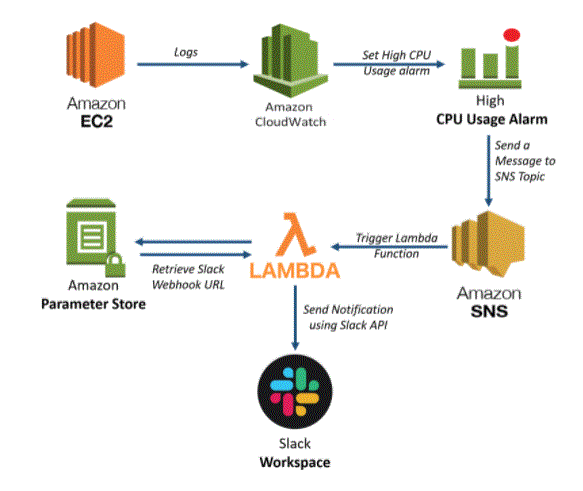
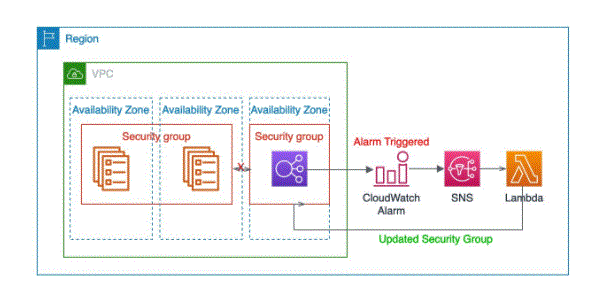
Once you’ve created or selected your metric, you can create alarms from it. You can set an alarm using AWS CloudFormation, AWS CLI or AWS Console. Alarms can subsequently generate an AWS EC2 action, perform an AWS auto scaling action, or send a notification to an AWS SNS topic. Below are the steps to create an alarm that will send an email when the metric detects a value exceeding my limit. When the alarm is triggered, it will send an email to the owner about the problem.
Step-by-Step : Create a Cloudwatch Alarm
- To configure the notification action, we first need to choose when the action should happen. The action may occur when the metric is in the alarm state, when the metric is not in the alarm state, or when the alarm has insufficient data to determine the alarm status. I have selected my alarm status to trigger an action when the metric is in the alarm state. Whenever more than 190 users have subscribed at once, the action will proceed.
- If you don’t already have an SNS theme setup, you can create one from this page. You will need to name your subject and enter an email address to use when alarm actions are triggered. Look for the new SNS topic on the Amazon SNS page under the Topics section. The name should appear as specified. Click on the topic to view more details and edit the topic.
- Editing the subject allows you to add or change the email addresses used in the SNS subject. SNS will list email addresses as unconfirmed unless the owner of the email follows the confirmation link sent to that email. If the alarm is triggered, the unconfirmed email will not receive a notification. When the alarm is triggered, the confirmed email will receive an email notifying them of the event. The email contains important information that the user may wish to take action on.
Send a Notification Action Using an SNS Topic:
Scale an AWS Service:
To configure the auto-scaling action, first determine when the alarm state should trigger the action. These are the same options as for sending SNS notifications (above). Next, choose which resource type to scale between the EC2 Auto Scaling Group and the ECS Service. You must configure the ECS and EC2 instances separately before they can be used in alarms. In each case, the alarm set will trigger more EC2 instances within the group or respectively start more ECS tasks to run.
Take EC2 action
Use an alarm to terminate, reboot, or recover the EC2 instance. Since the lambda triggers this alarm, I will not use this option here. If the metric used in the alarm is something other than the EC2 per-frequency metric, this option is not available. If you have that metric configured, a menu will appear like the image below to choose which actions are required.
OpsCenter Take Action
Ops Centre actions generate event logs for sys-ops data. If the metric used for CloudWatch alarms is tracking cost or performance, this action will log an event when those values reach a certain level. I would trigger a cost event log with this configuration when the cost severity would only be considered medium with this configuration. I’ll be allowed to intervene before the price is out of my budget
- Click the Log group in the breadcrumb trail at the top of the screen.
- Select the application.log group by clicking the radio button next to it, and then choose Create Metric Filter in the Actions list.
- Enter “ActiveStorage::InvariableError” (include quotes) for the filter pattern. This is a known error that we will make later in the lab.
- click next
- For Filter Name, type ActiveStorage-InvariableError
- In the Metrics namespace list, select ApplicationLogMetrics
- Enter ImageError as the metric name
- Enter 1 as the metric value
- click next
- Review the filter, and then click Create Metric Filter.
- Create alarm for error when metric limit is exceeded
- Select ActiveStorage-InvariableError by clicking the radio button next to it, and then select Create alarm.
- change duration to 10 seconds
- under conditions
- Select Static for Threshold Type
- For alarm status, 1 . select greater than/equal to
- Under Additional configuration, leave 1 of 1 for Datapoint on alarm
- Select Treat missing data as good (not limit violation) to treat it as missing data.
- under notification
- Select in alarm for triggering alarm status
- Select Choose current SNS topic to select an SNS topic
- Under Send a notification to., select the SNS topic you created
- Click Next
- ImageErrorAlarm for name
- click next
- Review the alarm, and click Create alarm
Create Alarms for Known Issues from Metrics:
Monitoring for Application Results Ryn Brandish wants to understand when there is an application issue and is concerned about security. He wants metrics for errors and warnings. ExampleCorp has limits on the image size it can successfully process. Although this problem doesn’t happen frequently, it doesn’t make customers happy. Being aware of the error rates for submitted images will allow the business and development team to determine whether increasing the image size should be a priority. Currently most of the warnings are related to security issues. Ryn would like to see how often they happen.
5.1 Create a log filter metric based on the set threshold for error
- Enter admin@admin.com for email
- Enter password123 for Password
- Click on Login
- Click Upload Image Click Select Image
- Find break_app.jpg in your file system
- click on upload
- 5.4 Review the log to identify the error
- Navigate to CloudWatch Console
- Click on Log in the navigation menu
- Click on the application.log Log group – this is from /opt/ExampleCorp/log/application.log as previously configured in the CloudWatch agent configuration.
- Click on the Search Log Group button
- Enter ERROR (case sensitive) and press Enter.
- You will see errors terminating ActiveStorage::InvariableError . This is an error that occurs when a user uploads a non-image file. This is a known issue, but the dev team doesn’t have the cycles to address it.
Generate error logs through user activity:
Navigate to ExampleCorp using the URL you noted earlier (CloudFormation output).
Note: The application will start displaying problems, and the application will eventually fail to load.
Conclusion:
You can use Amazon CloudWatch Logs to monitor, store, and access your log files from Amazon Elastic Compute Cloud (Amazon EC2) instances, AWS CloudTrail, Route 53, and other sources. CloudWatch Logs enables you to centralise logs from all your systems, applications, and AWS services that you use, into a single, highly scalable service. You can then easily view them, search them for specific error codes or patterns, filter them by specific fields, or store them securely for future analysis. CloudWatch Logs enables you to view all your logs, regardless of their source, as a single and consistent flow of events by time, and you can query them and sort them by other dimensions , group them by specific field, and visualise the log. Data in Dashboard.
Pulumi Crosswalk for AWS supports configuring CloudWatch logging in the following ways:
Creating Log Groups: A log group is a collection of logs with some policies around retention and archival, to which logs can be sent from multiple AWS services. The aws.cloudwatch.LogGroup class can be used to create and configure new log groups.
Forwarding Log Groups: From any of the supported services, CloudWatch Log Groups can be supplied to configure said service to forward logs to that log group. Many services help do this. For example, ECS tasks and services provide a LogGroup property that, when set, forwards all logs from your container instance.
Automatic Smart Defaults: In many cases, using Pulumi Crosswalk for AWS uses smart defaults for any service you choose, so that automatic log grouping and retention policies can be used. So even if you don’t specify the log group explicitly, the logging is often happening on your behalf.
View log group output: For any log group in your Pulumi program, running the Pulumi logs command line will aggregate and stream the most recent log entries to the console. The –follow option enables you to view logs as they appear in real time, because –follows only views log entries within a certain time period, and –resource allows you to filter specific log groups. Read more on Unified Logs with Pulumi Logs.


