- Introduction to AWS X-Ray
- Why to Use AWS X-Ray?
- How AWS X-Ray Works
- Setting Up AWS X-Ray
- Tracing and Monitoring with X-Ray
- Integrating X-Ray with AWS Services
- AWS X-Ray SDK and APIs
- Analyzing Application Performance
- Security and Compliance in AWS X-Ray
- AWS X-Ray Best Practices
- Pricing Model of AWS X-Ray
- Conclusion
Introduction to AWS X-Ray
In contemporary cloud programs, following the flow of requests and knowing how different components perform is key to reliability and problem-solving. AWS X-Ray is a high-utility service that enables application developers and operations teams to debug and analyze distributed applications. With it, you can trace and monitor requests through your microservices, giving insights into application performance, bottlenecks, and failures. AWS X-Ray makes spotting and fixing performance problems in real-time more manageable. It provides visibility into the individual services, requests, and resources in your AWS environment. With detailed visibility into request latency, failure counts, and service dependencies, X-Ray allows developers to identify root causes of issues and make their applications more efficient and reliable. Amazon Web Services Training helps developers understand and utilize X-Ray effectively to optimize application performance and troubleshoot issues efficiently. This guide will outline the major features, usage, and best practices for successfully using AWS X-Ray.
Why to Use AWS X-Ray?
There are a few good reasons why AWS X-Ray is an invaluable resource for today’s cloud-based applications, particularly microservices and distributed architectures.
- End-to-end Request Tracing: AWS X-Ray facilitates end-to-end tracing of requests as they travel through multiple services, giving you a comprehensive overview of how the individual components of your application are performing. Through this tracing, you can pinpoint real-time latencies, errors, and performance bottlenecks.
- In-depth insights into Application Performance: X-Ray enables you to gain visibility into every segment of your application’s lifecycle. By examining every trace, you can observe how long every service call took, how resources are utilized, and where failures or delays happen, making it more straightforward to optimize performance.
- Distributed Tracing Across Microservices: Modern applications can have many microservices collaborating. The AWS Well Architected Framework emphasizes the importance of observability in distributed systems. AWS X-Ray offers robust distributed tracing features to observe how requests travel through various services and where problems happen during these interactions.
- Proactive Error and Latency Detection: By continuously tracing applications, AWS X-Ray automatically identifies and notifies you of errors, high latency, or anomalous behavior. This head-on detection allows you to debug issues before they affect end users.
- Improved Debugging Functionality: AWS X-Ray simplifies debugging by reporting detailed, granular information on application performance. It enables developers to quickly grasp which services or resources are performing below par, thus improving the troubleshooting process more effectively.
Eager to Acquire Your AWS Certification? View The AWS Training Offered By ACTE Right Now!
How AWS X-Ray Works
AWS X-Ray retrieves trace data from your application’s components and builds maps of the detailed interactions between these components. It records requests, responses, errors, and time spent in each section of the system.AWS X-Ray retrieves trace data from your application’s components and builds maps of the detailed interactions between these components. It records requests, responses, errors, and time spent in each section of the system. Trace Data Collection, when your application receives a request, X-Ray captures trace data, such as details of the request’s flow through various services, such as latency, errors, and dependencies. Each trace is for one request, and X-Ray captures metadata about each operation included in that request. Segments and Subsegments, in AWS X-Ray, trace data is split into segments and subsegments. A segment is one unit of work, for example, an HTTP call to a service or a database call. A subsegment is a more detailed granularity of work within a segment, for example, database queries, calls to external services, or interactions with AWS Pinpoint . These subsegments and segments are collected into a trace that displays the sequence of a request through the system. Annotations and Metadata, X-Ray enables you to attach annotations and metadata to traces. Annotations are key-value pairs that can be used to search and filter traces, while metadata holds additional information about individual subsegments or segments, like HTTP headers or request parameters.Service Map, AWS X-Ray employs trace data to produce a service map that displays your services and how they connect. The map displays the services, their association, latency, errors, or throughput figures that could affect the performance.Sampling, AWS X-Ray employs Sampling to prevent the system from being overwhelmed by excessive trace data. This is not to say that every request is traced, but rather, a representative sample is chosen for thorough examination. You can set the sampling rate to optimize performance against the required detail.

Setting Up AWS X-Ray
Setting up AWS X-Ray in your AWS environment is relatively easy. Here’s how you can begin using it:
1. Set up an X-Ray Daemon The X-Ray daemon gathers and sends trace data to AWS X-Ray. You can execute the daemon on an EC2 instance, container, or Lambda function.
EC2/Container: Install the X-Ray daemon using the proper setup method (e.g., AWS Systems Manager or Amazon Linux AMI).
Lambda: AWS Lambda supports X-Ray natively. You can turn on tracing by updating the Lambda function configuration.
2. Integrate X-Ray SDK: You must incorporate the AWS X-Ray SDK into your application code to obtain trace data from your application. X-Ray SDKs support several programming languages like Java, Node.js, Python , .NET, and Go. The SDK automatically captures trace data by instrumenting your code.
3. Configure Sampling Rules: Set up sampling rules to govern the amount of trace data obtained. The standard sampling rate is usually designed to record one request per second, but this can be tailored to your application’s needs.
4. Activate X-Ray in AWS Services Most AWS services, such as AWS Lambda, API Gateway, Elastic Load Balancer (ELB), and EC2, natively support X-ray integration. You can turn X-ray tracing on for these services from their respective consoles or by using Cloud Formation.
5. Examine Trace Data in the X-Ray Console: After X-Ray is installed and your application submits trace data, you can see it in the AWS X-Ray console. The console enables you to search and filter trace data, examine service maps, and drill down on individual traces to see performance bottlenecks or errors.
Tracing and Monitoring with X-Ray
AWS X-Ray offers rich tracing and monitoring capabilities for requests through your distributed system. The service map may be X-Ray’s biggest strength. It graphically displays your whole application, illustrating how all the services are connected and how requests flow between them. From this map, you can determine what parts of your application are bottlenecks, how latency occurs, and where service failures occur. With AWS X-Ray, you can filter and search trace data by multiple attributes in AWS Training . You can trace specific requests, see how services are performing, and diagnose root causes of latency or failures. X-Ray offers in-depth error rate and latency metrics for each segment and subsegment of your traces. Using this information, you can monitor the health of your application and detect problems before they reach end users. You can use X-ray to drill down into a specific request and observe the amount of time each service call spent, which might lead you to identify certain services or operations that need to be optimized.
Ready to Earn Your AWS Certificate? View The AWS Course Offered By ACTE Right Now!
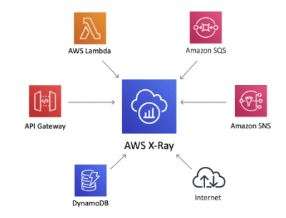
Integrating X-Ray with AWS Services
AWS X-Ray works natively with many AWS services, allowing you to trace requests through your entire AWS stack:
- AWS Lambda X-Ray has native support for AWS Lambda. You can turn tracing on for specific Lambda functions to trace requests and monitor performance.
- Amazon API Gateway X-Ray is integrated with Amazon API Gateway, enabling you to trace calls through the gateway and backend resources. This offers complete visibility of the request path from the client to the backend.
- Elastic Load Balancer (ELB) If you’re load-balancing traffic to your application instances using an Amazon Elastic load Balancer , you can integrate X-Ray to trace requests that travel through the load balancer.
- Amazon EC2 and Containers EC2 instances and containers deployed in Amazon ECS or EKS can forward trace data to X-Ray, providing tracing for containerized and virtual machine-based applications.
- Amazon DynamoDB X-Ray supports integration with DynamoDB so that you can trace database calls and monitor the performance of your database operations.

AWS X-Ray SDK and APIs
AWS X-Ray SDK gives you libraries and tools for including X-Ray tracing in your applications. The SDK is provided for several programming languages and frameworks:
- Java SDK
- Node.js SDK
- Python SDK
- .NET SDK
- Go SDK
The SDK automatically monitors your code, including calls to services and other pieces of code. It can also collect custom events and metadata so you can monitor particular application behavior. You may also access X-Ray programmatically via the AWS X-Ray API. You can use the following to manage traces, get data, and perform automated things like creating custom subsegments or segments for finer monitoring. This process is part of What is API Testing, which involves verifying and validating APIs to ensure they function correctly, meet performance expectations, and handle edge cases effectively.
Analyzing Application Performance
After instrumenting your application with AWS X-Ray, you can carefully analyze its performance. X-Ray offers various tools for diagnosing performance issues:
- Latency Analysis X-ray assists you in measuring and visualizing latency at every part of your application. You can see where there is latency and whether a particular service should be optimized.
- Failure Rate Monitoring X-ray monitors the success and failure rates of various services and components. You can implement alerts to trigger when failure rates exceed a threshold, giving you time to act before troubles affect users.
- Trace Analytics X-Ray’s trace analytics in AWS X-Ray enable you to filter and search traces by specific parameters, including error messages, response times, and service dependencies. This facilitates easier issue identification and resolution.
Exploring Options for AWS Master’s Degree? Enroll For AWS Master Course Today!
Security and Compliance in AWS X-Ray
AWS X-Ray is secure by design. It encrypts trace data in transit and at rest and follows AWS’s general security best practices. You can also restrict who can access your trace data by using AWS Identity and Access Management (IAM) policies. If AWS X-Ray is being utilized within a regulated system, industry compliance should be followed. AWS X-Ray supports logging and auditing to assist in ensuring trace data management compliance.
AWS X-Ray Best Practices
- Use Sampling – Configuring the sampling rates suitably according to your application’s needs can prevent trace data explosion and reduce costs.
- Monitor Dependencies Periodically inspect the service map and track dependencies to identify areas for optimization or potential trouble that may affect performance.
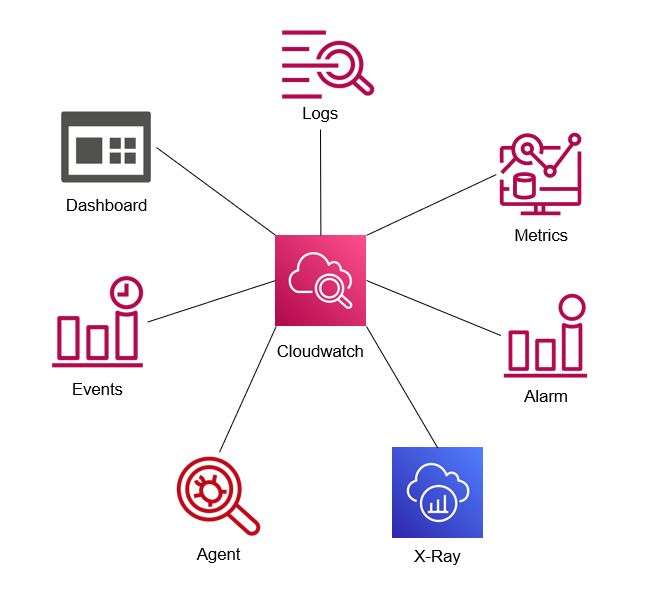
- Configure High Latency or Error Rate Alerts Utilize AWS CloudWatch and X-Ray’s X-Rays integration to configure high latency or elevated error rate alerts so you can react quickly to issues as they arise.
- Integrate with Other AWS Services Integrate AWS X-Ray with other AWS monitoring and logging services, such as AWS CloudWatch and AWS CloudTrail, to gain end-to-end insights into your application’s health and performance.
Getting Ready for a AWS Job Interview? Check Out Our Blog on AWS Interview Questions & Answer
Pricing Model of AWS X-Ray
AWS X-Ray pricing is a function of how much trace data is collected and how many traces are analyzed. Charges generally involve:
Trace storage and processing: Pricing is per volume of data collected and processed by X-Ray.
Additional capabilities: Certain capabilities, like custom sampling, might be extra.
AWS provides a free tier for X-Ray with limited trace storage and processing each month. AWS X-Ray is a valuable tool for operations teams and developers who require visibility into their application performance, particularly in sophisticated distributed systems. By including AWS X-Ray, you obtain insights into latency, errors, and service dependencies so that you can optimize your applications for greater reliability and performance.
Conclusion
AWS X-Ray is a powerful tool for monitoring, tracing, and debugging distributed applications, particularly in cloud-based and microservices architectures. It provides deep insights into request flows, application performance, and potential bottlenecks, helping developers optimize their applications efficiently. By integrating X-Ray with AWS services, leveraging SDKs, following best practices like sampling and proactive monitoring, and incorporating AWS Training , organizations can enhance reliability, reduce troubleshooting time, and improve user experience. With built-in security, compliance support, and cost-effective pricing, AWS X-Ray is an essential component for maintaining high-performance cloud applications.


